Chart pattern
BCC chart pattern — Boise Cascade
1 formation detected on the latest close (Nov 10, 2026).
Descending Channel · Weekly candles
BearishForming
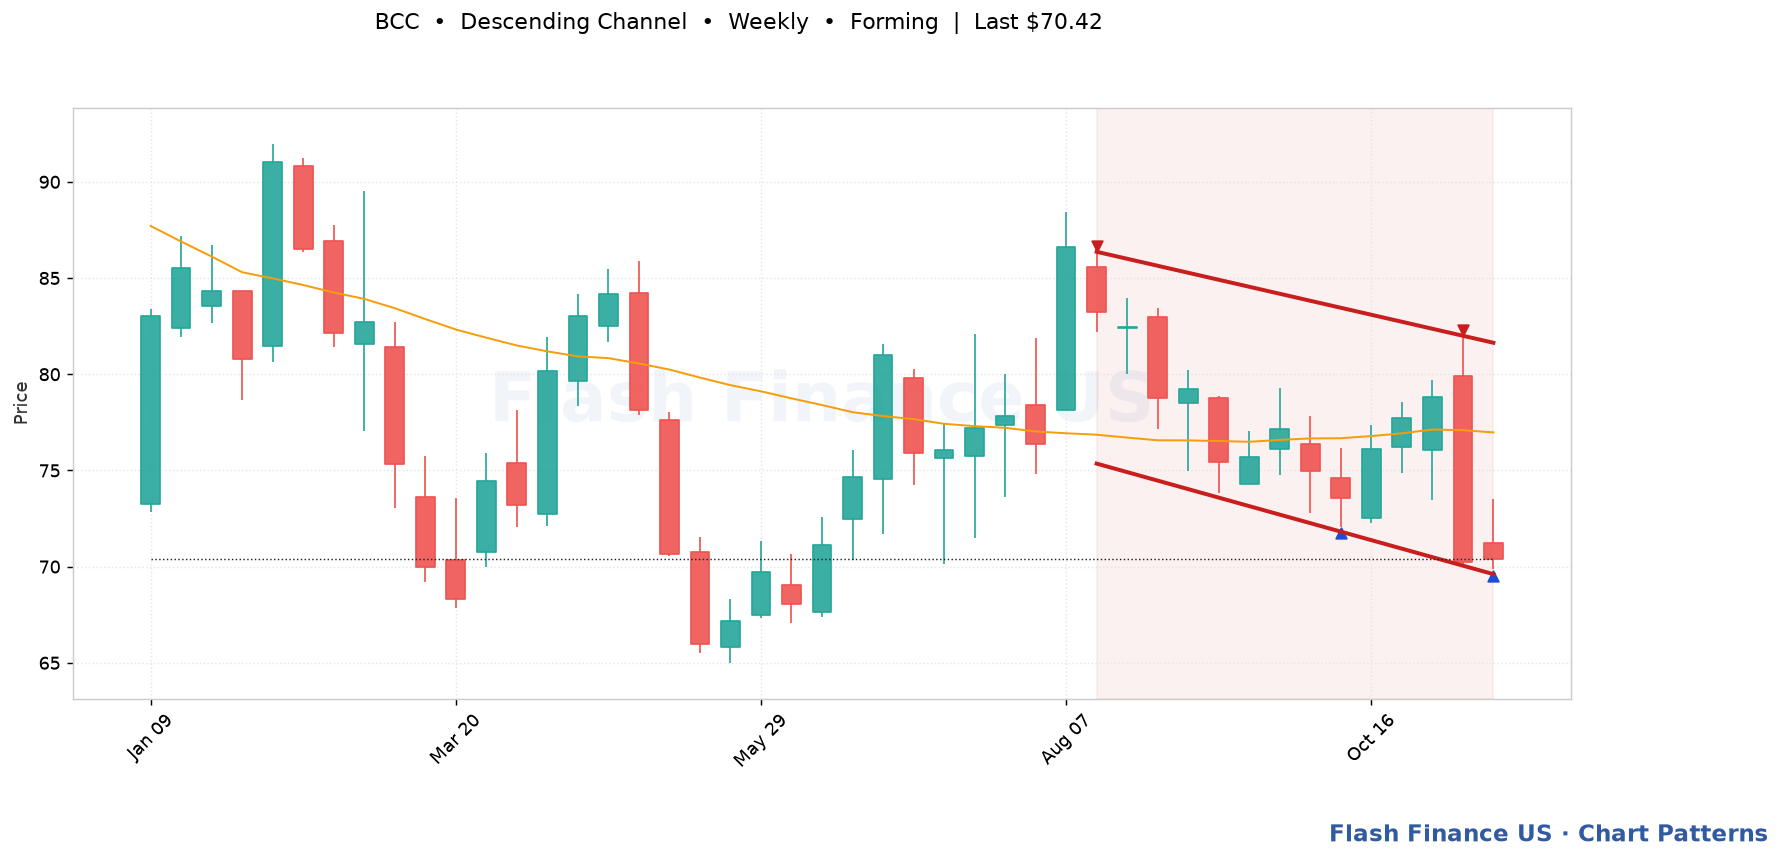
Last close$70.42
Trigger$69.61 (-1.2%)
Upper boundary$81.64
Lower boundary$69.61
Pattern spanAug 14, 2026 → 13 bars
Touches4
Fit score65/100
A steady downtrend held between two parallel falling lines. Trigger: A close above the upper rail is the first real sign the downtrend is ending. A close below the lower rail is capitulation. Invalidation: A sustained close above the upper rail.
Automated detection for education and research; not a recommendation. Levels are drawn from split-adjusted daily prices.