Chart pattern
BJ chart pattern — BJ's Wholesale Club
2 formations detected on the latest close (Nov 09, 2026).
Ascending Channel · Daily candles
BullishForming

Last close$109.80
Trigger$115.81 (+5.5%)
Upper boundary$115.81
Lower boundary$107.87
Pattern spanSep 28, 2026 → 30 bars
Touches8
Fit score99/100
A steady uptrend held between two parallel rising lines. Trigger: Inside the channel, the lower rail is the buy zone. A close below it warns the trend is breaking; a close above the upper rail is an acceleration. Invalidation: A sustained close below the lower rail.
Double Bottom · Weekly candles
Bullish▲ Broken out
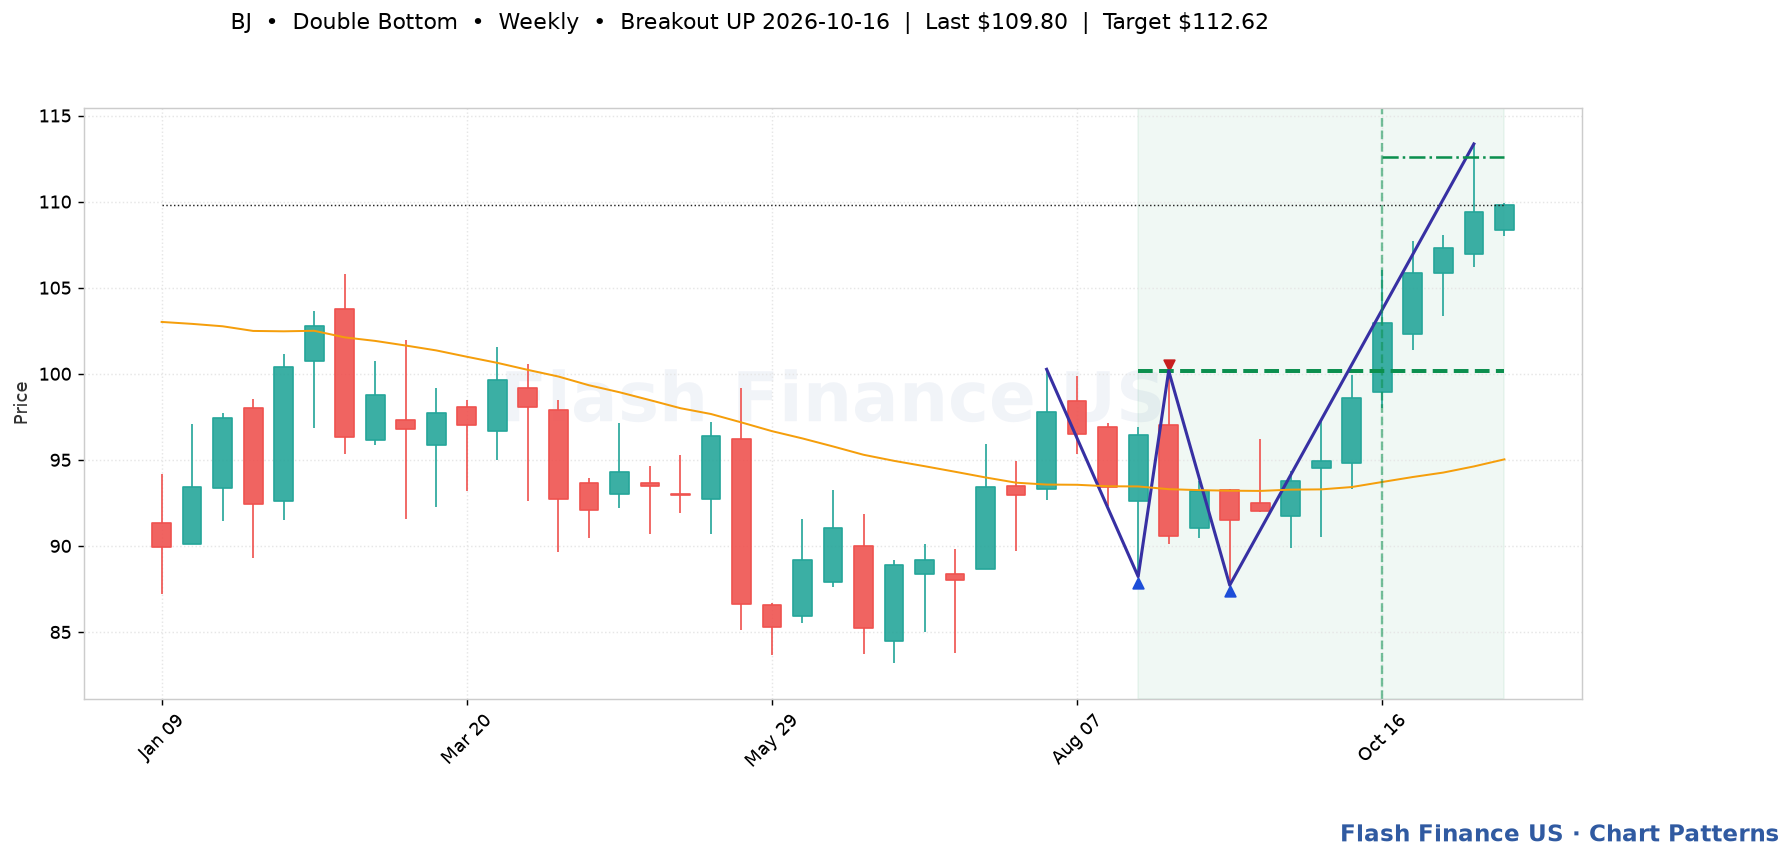
Last close$109.80
Break dateOct 16, 2026
Break level$100.17
Bars since break4
Break volume1.2x avg
Measured target$112.62 (+2.6%)
Pattern spanAug 21, 2026 → 12 bars
Touches3
Fit score70/100
Two successful defences of the same low, separated by a rally — the classic W. Trigger: A close above the neckline — the high between the two lows. Invalidation: A close below the twin lows.
Automated detection for education and research; not a recommendation. Levels are drawn from split-adjusted daily prices.