Chart pattern
DUK chart pattern — Duke Energy
2 formations detected on the latest close (Nov 06, 2026).
Inverse Head and Shoulders · Daily candles
BullishForming

Last close$127.78
Trigger$132.99 (+4.1%)
Pattern spanJul 15, 2026 → 81 bars
Touches5
Fit score90/100
Three troughs with the middle one deepest — the classic bottoming pattern. Trigger: A close above the neckline, ideally on rising volume. Invalidation: A close below the right shoulder, and certainly below the head.
Triple Top · Weekly candles
BearishForming
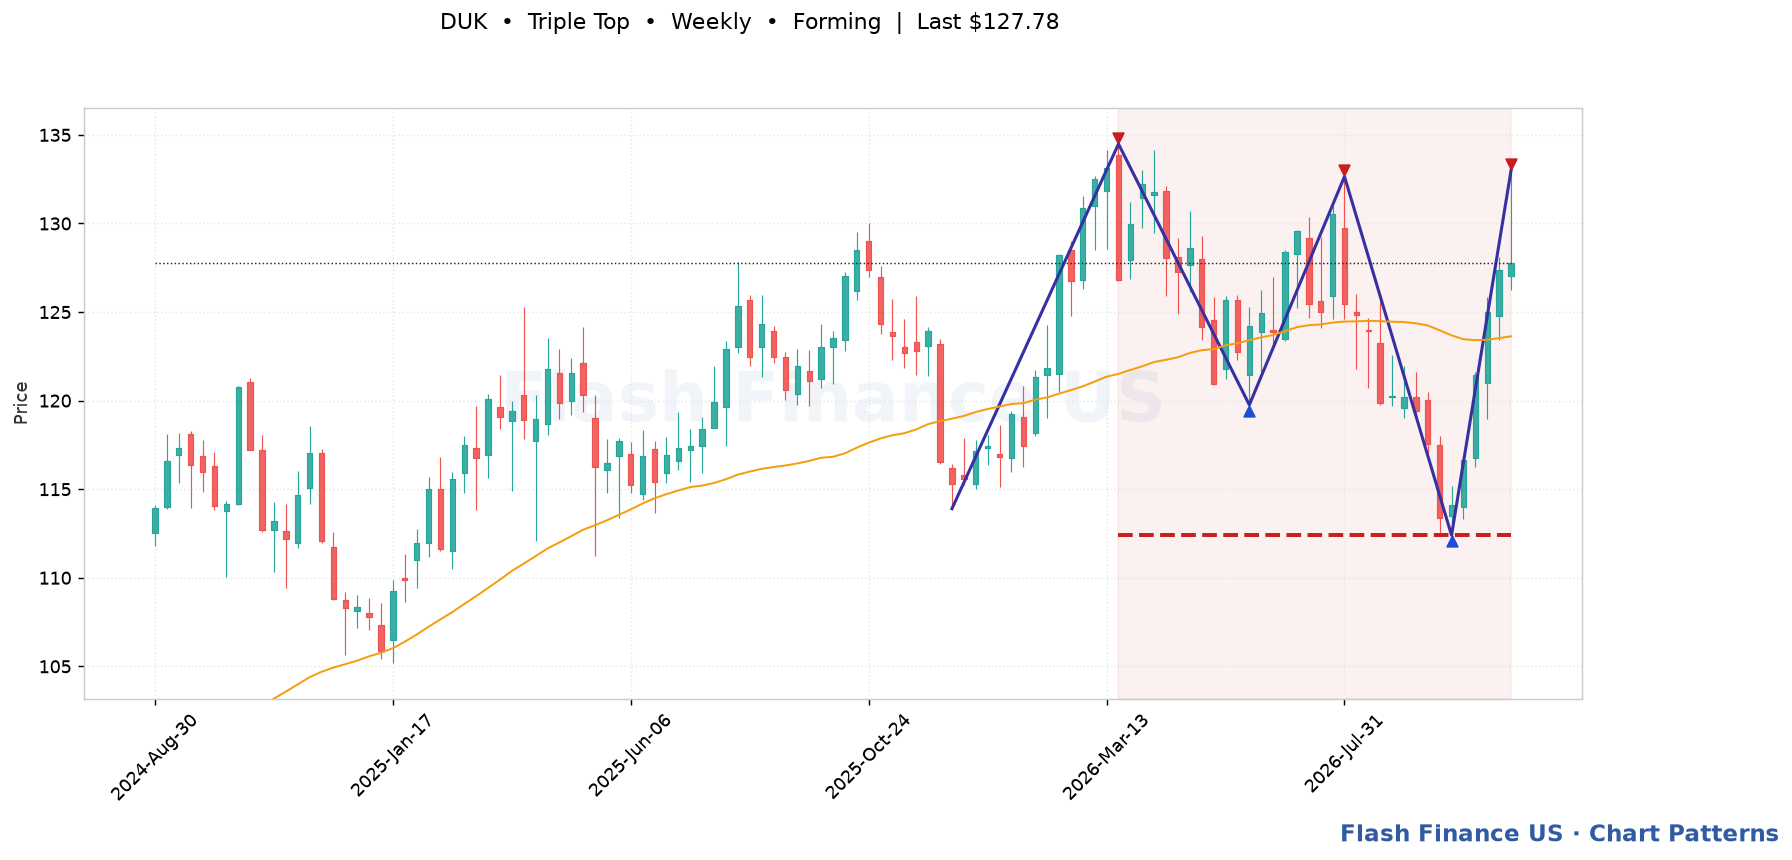
Last close$127.78
Trigger$112.40 (-12.0%)
Pattern spanMar 20, 2026 → 33 bars
Touches5
Fit score85/100
Three failed attempts at the same high — heavier supply than a double top. Trigger: A close below the neckline drawn through the intervening lows. Invalidation: A close above the three peaks — a level tested three times and then cleared is a strong bullish signal.
Automated detection for education and research; not a recommendation. Levels are drawn from split-adjusted daily prices.