Chart pattern
FANG chart pattern — Diamondback Energy
1 formation detected on the latest close (Nov 09, 2026).
Triple Top · Weekly candles
Bearish▼ Broken down
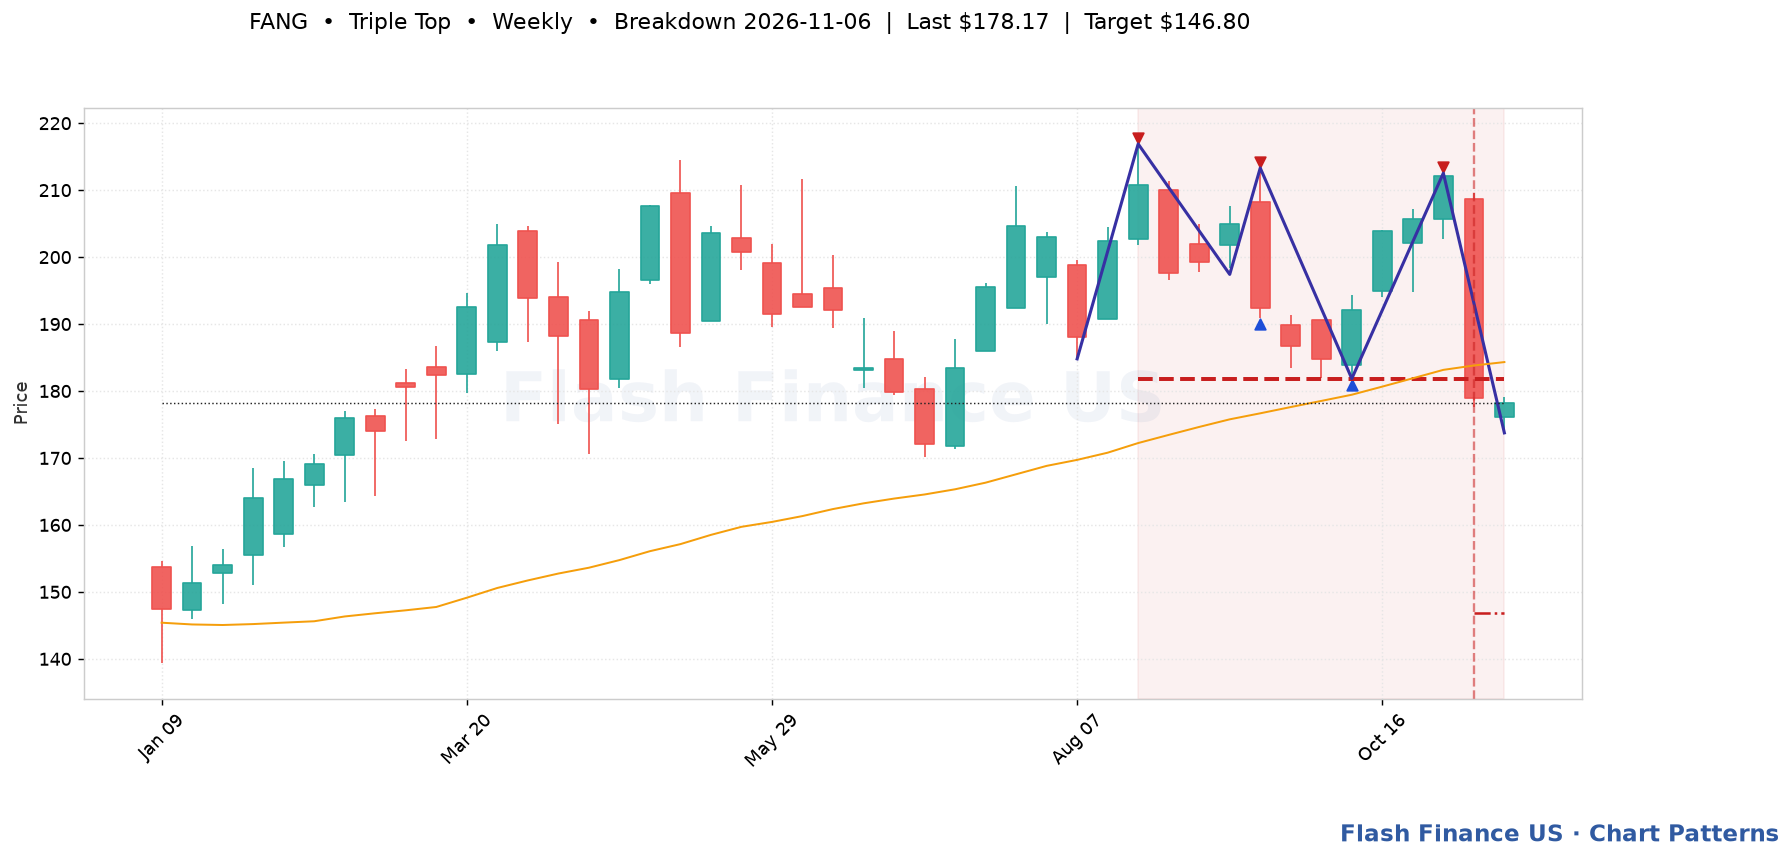
Last close$178.17
Break dateNov 06, 2026
Break level$181.85
Bars since break1
Break volume1.3x avg
Measured target$146.80 (-17.6%)
Pattern spanAug 21, 2026 → 12 bars
Touches5
Fit score96/100
Three failed attempts at the same high — heavier supply than a double top. Trigger: A close below the neckline drawn through the intervening lows. Invalidation: A close above the three peaks — a level tested three times and then cleared is a strong bullish signal.
Automated detection for education and research; not a recommendation. Levels are drawn from split-adjusted daily prices.