Chart pattern
GEHC chart pattern — GE HealthCare
1 formation detected on the latest close (Nov 11, 2026).
Bull Flag · Daily candles
BullishForming
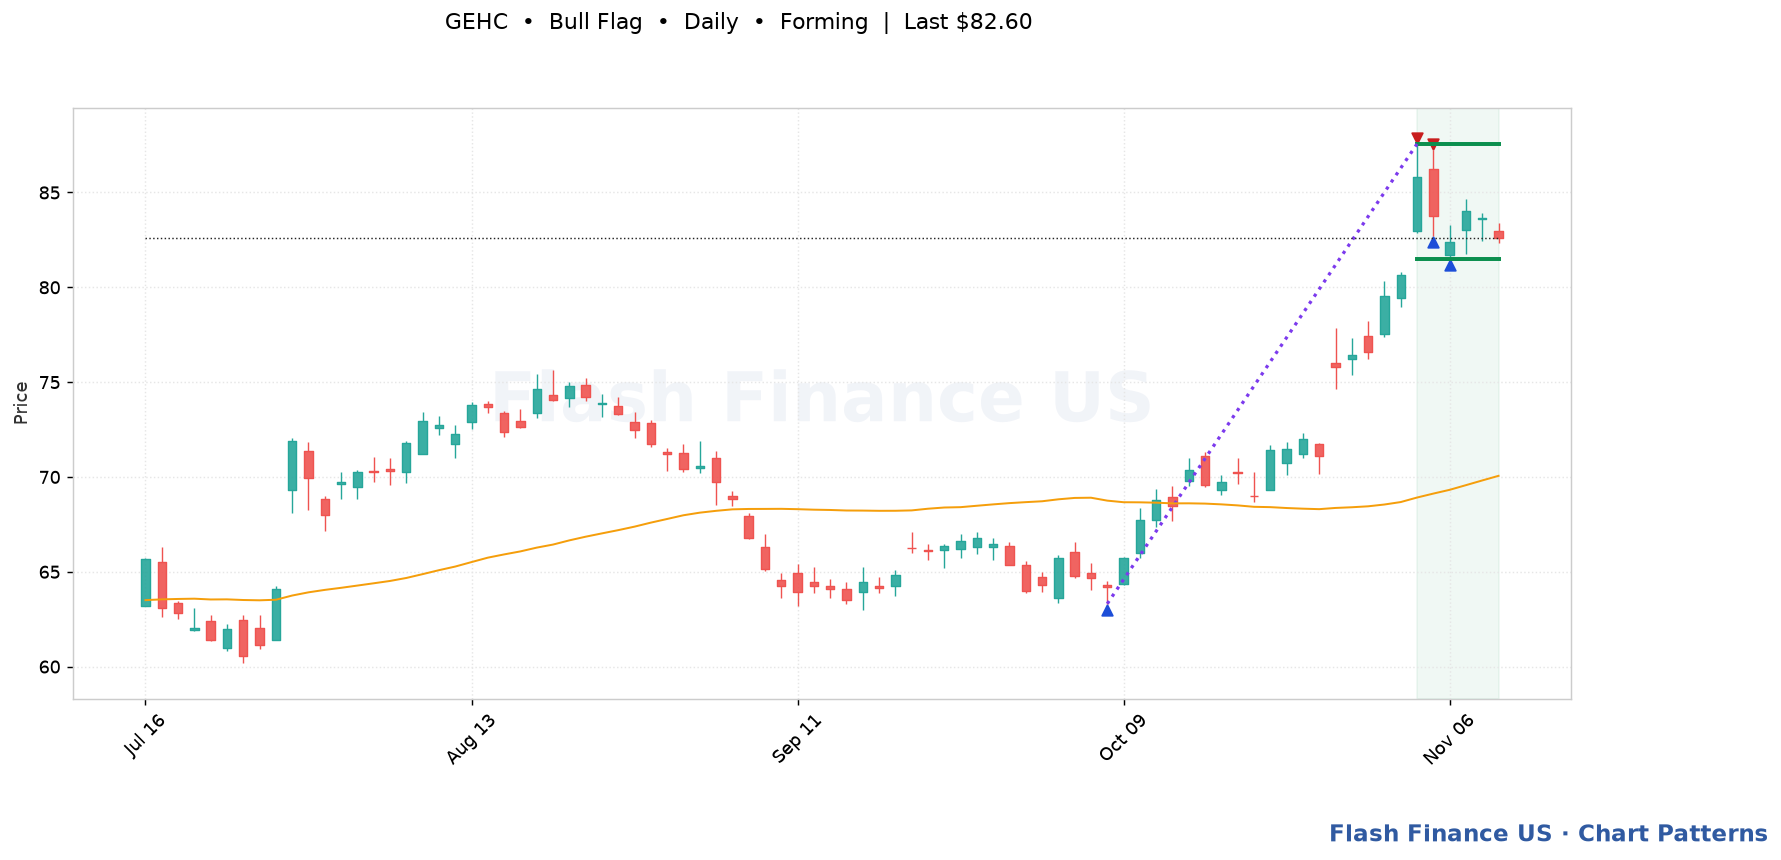
Last close$82.60
Trigger$87.56 (+6.0%)
Upper boundary$87.56
Lower boundary$81.49
Pattern spanOct 8, 2026 → 24 bars
Touches5
Fit score78/100
A sharp advance, then a tight drift lower — a trend catching its breath. Trigger: A close above the flag's upper boundary. Invalidation: A pullback that retraces much more than half the pole, or a close below the flag's lower boundary. At that point it is a reversal, not a pause.
Automated detection for education and research; not a recommendation. Levels are drawn from split-adjusted daily prices.