Chart pattern
HLT chart pattern — Hilton Worldwide
2 formations detected on the latest close (Nov 06, 2026).
Double Bottom · Weekly candles
Bullish▲ Broken out

Last close$370.45
Break dateNov 06, 2026
Break level$358.00
Bars since break0
Break volume1.0x avg
Measured target$416.00 (+12.3%)
Pattern spanMay 08, 2026 → 26 bars
Touches3
Fit score74/100
Two successful defences of the same low, separated by a rally — the classic W. Trigger: A close above the neckline — the high between the two lows. Invalidation: A close below the twin lows.
Rising Wedge · Daily candles
BearishForming
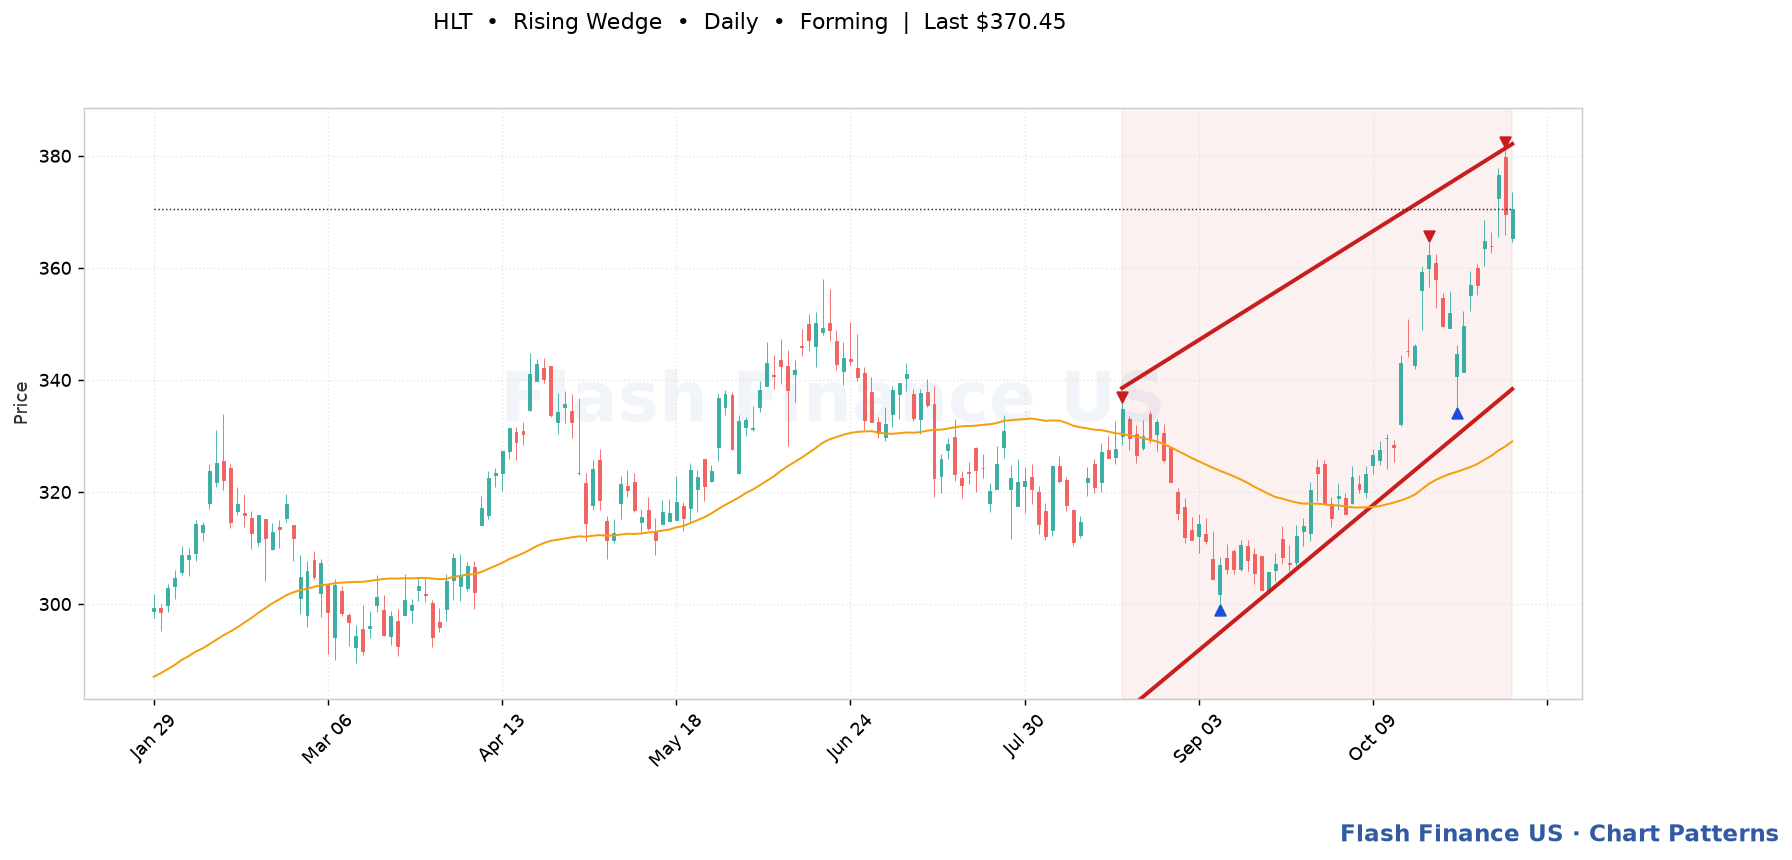
Last close$370.45
Trigger$338.38 (-8.7%)
Upper boundary$382.12
Lower boundary$338.38
Pattern spanAug 19, 2026 → 56 bars
Touches5
Fit score72/100
Price grinding higher inside two rising lines that are closing together — an advance running out of air. Trigger: A close below the rising lower boundary. Invalidation: A decisive close above the upper boundary, which turns the wedge into an ordinary acceleration.
Automated detection for education and research; not a recommendation. Levels are drawn from split-adjusted daily prices.