Chart pattern
LAMR chart pattern — Lamar Advertising
2 formations detected on the latest close (Nov 06, 2026).
Inverse Head and Shoulders · Daily candles
BullishForming
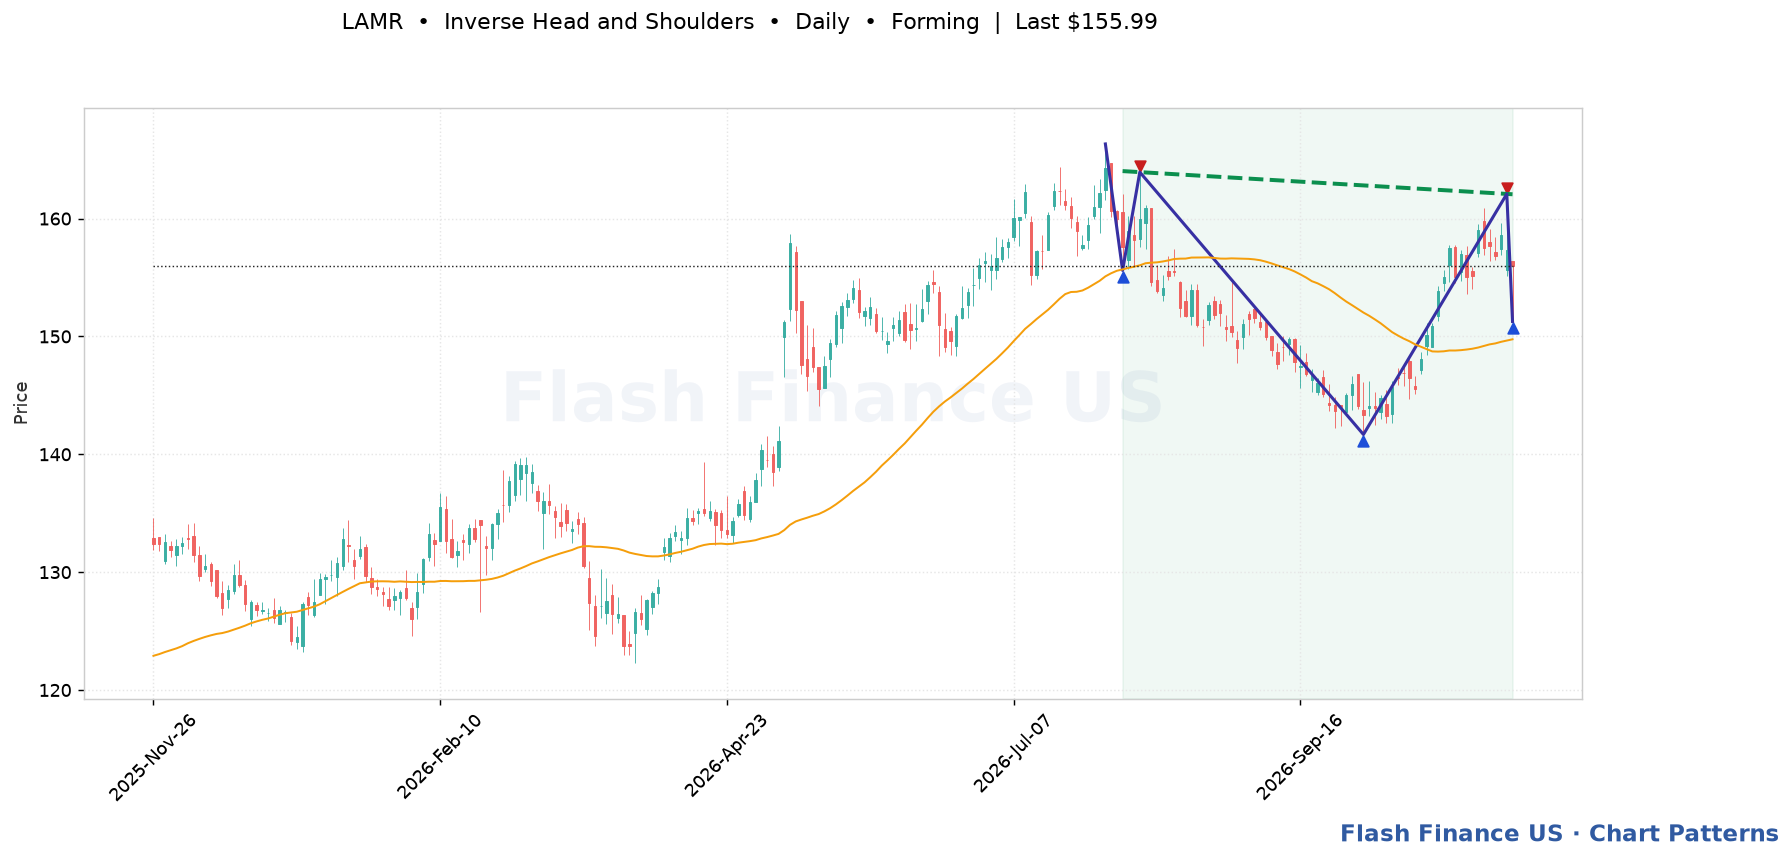
Last close$155.99
Trigger$162.06 (+3.9%)
Pattern spanAug 03, 2026 → 68 bars
Touches5
Fit score89/100
Three troughs with the middle one deepest — the classic bottoming pattern. Trigger: A close above the neckline, ideally on rising volume. Invalidation: A close below the right shoulder, and certainly below the head.
Symmetrical Triangle · Weekly candles
NeutralForming

Last close$155.99
Trigger—
Upper boundary$162.09
Lower boundary$142.71
Pattern spanMay 08, 2026 → 26 bars
Touches4
Fit score73/100
Lower highs and higher lows squeezing into a point — a coiling market that has not chosen a side yet. Trigger: A close outside either boundary. The direction of the break is the signal — the pattern itself does not predict it. Invalidation: Price closing back inside the triangle after breaking out — a common trap in low-volume breaks.
Automated detection for education and research; not a recommendation. Levels are drawn from split-adjusted daily prices.