Chart pattern
MLI chart pattern — Mueller Industries
1 formation detected on the latest close (Nov 16, 2026).
Double Top · Weekly candles
Bearish▼ Broken down
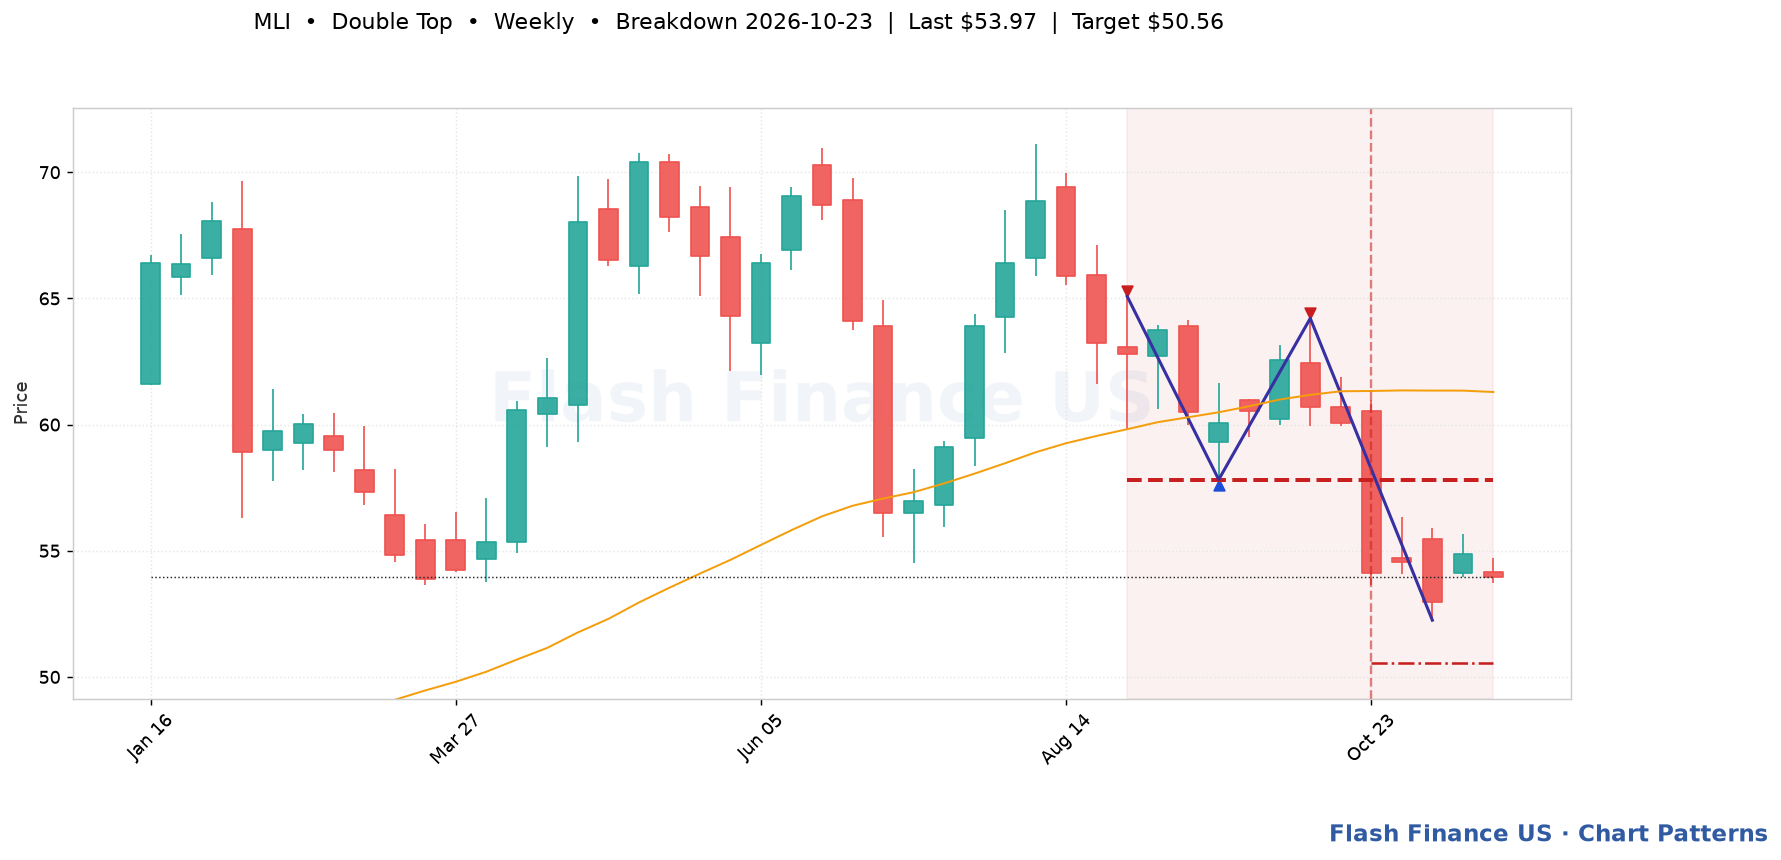
Last close$53.97
Break dateOct 23, 2026
Break level$57.82
Bars since break4
Break volume1.7x avg ✓
Measured target$50.56 (-6.3%)
Pattern spanAug 28, 2026 → 12 bars
Touches3
Fit score76/100
Two failed attempts at the same high, separated by a dip — the classic M. Trigger: A close below the neckline — the low between the two peaks. Until that happens it is just a pullback. Invalidation: A close above the twin peaks, which turns the whole thing into a base rather than a top.
Automated detection for education and research; not a recommendation. Levels are drawn from split-adjusted daily prices.