Chart pattern
SAFT chart pattern — Safety Insurance Group
1 formation detected on the latest close (Nov 06, 2026).
Double Bottom · Weekly candles
BullishForming
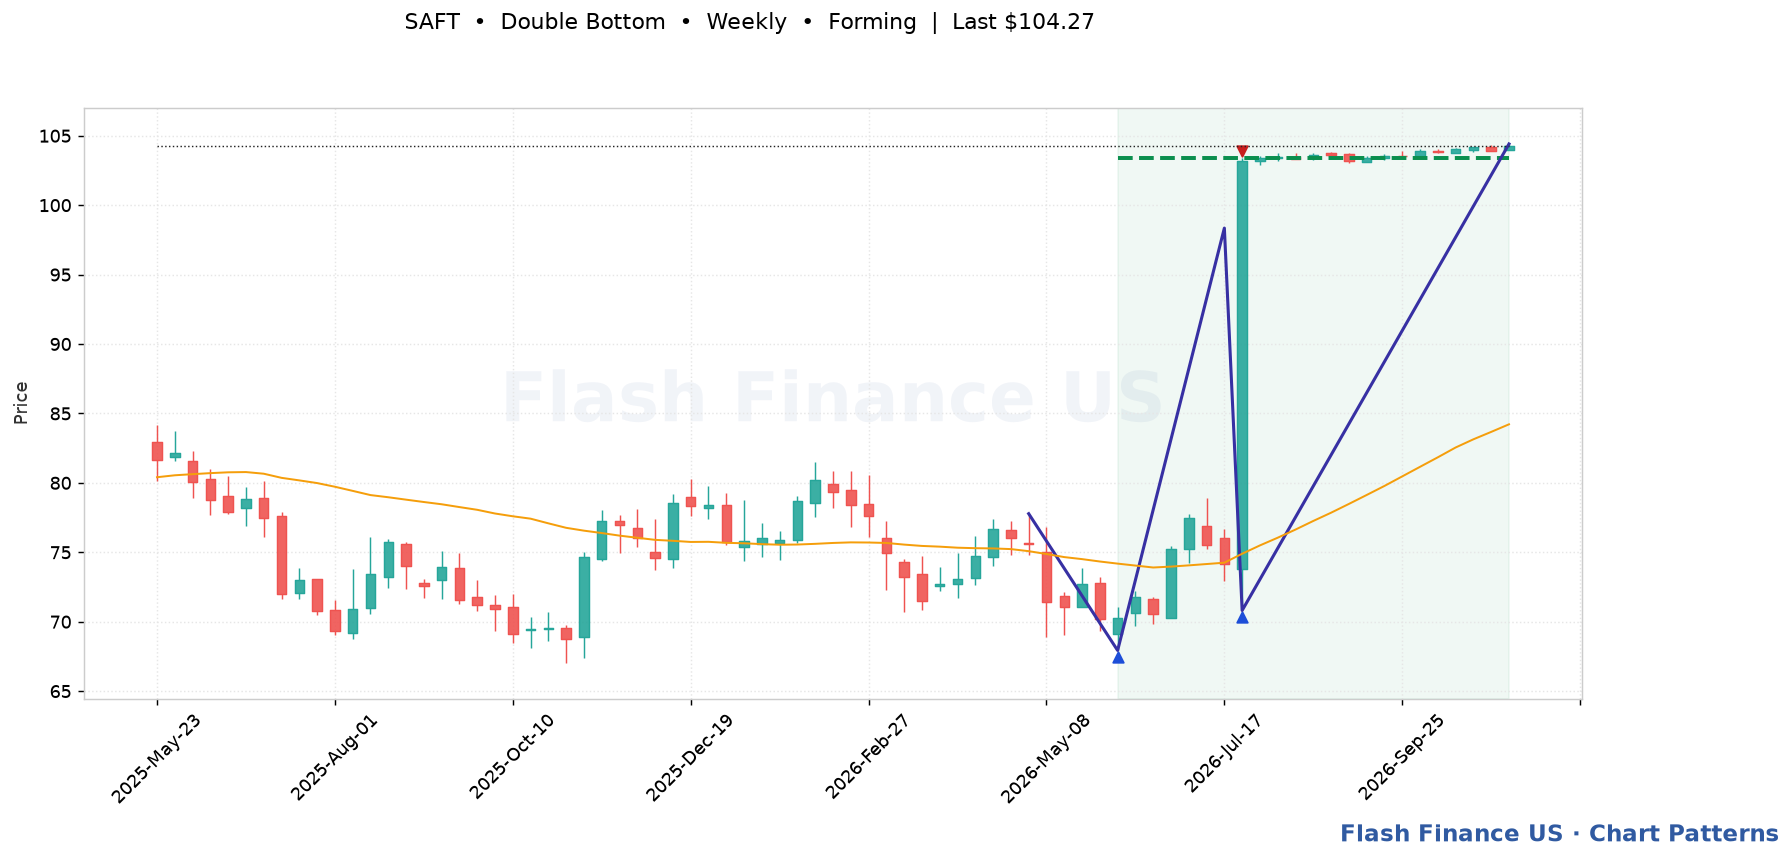
Last close$104.27
Trigger$103.42 (-0.8%)
Pattern spanJun 05, 2026 → 22 bars
Touches3
Fit score59/100
Two successful defences of the same low, separated by a rally — the classic W. Trigger: A close above the neckline — the high between the two lows. Invalidation: A close below the twin lows.
Automated detection for education and research; not a recommendation. Levels are drawn from split-adjusted daily prices.