Chart pattern
TTC chart pattern — Toro
1 formation detected on the latest close (Nov 06, 2026).
Inverse Head and Shoulders · Weekly candles
Bullish▲ Broken out
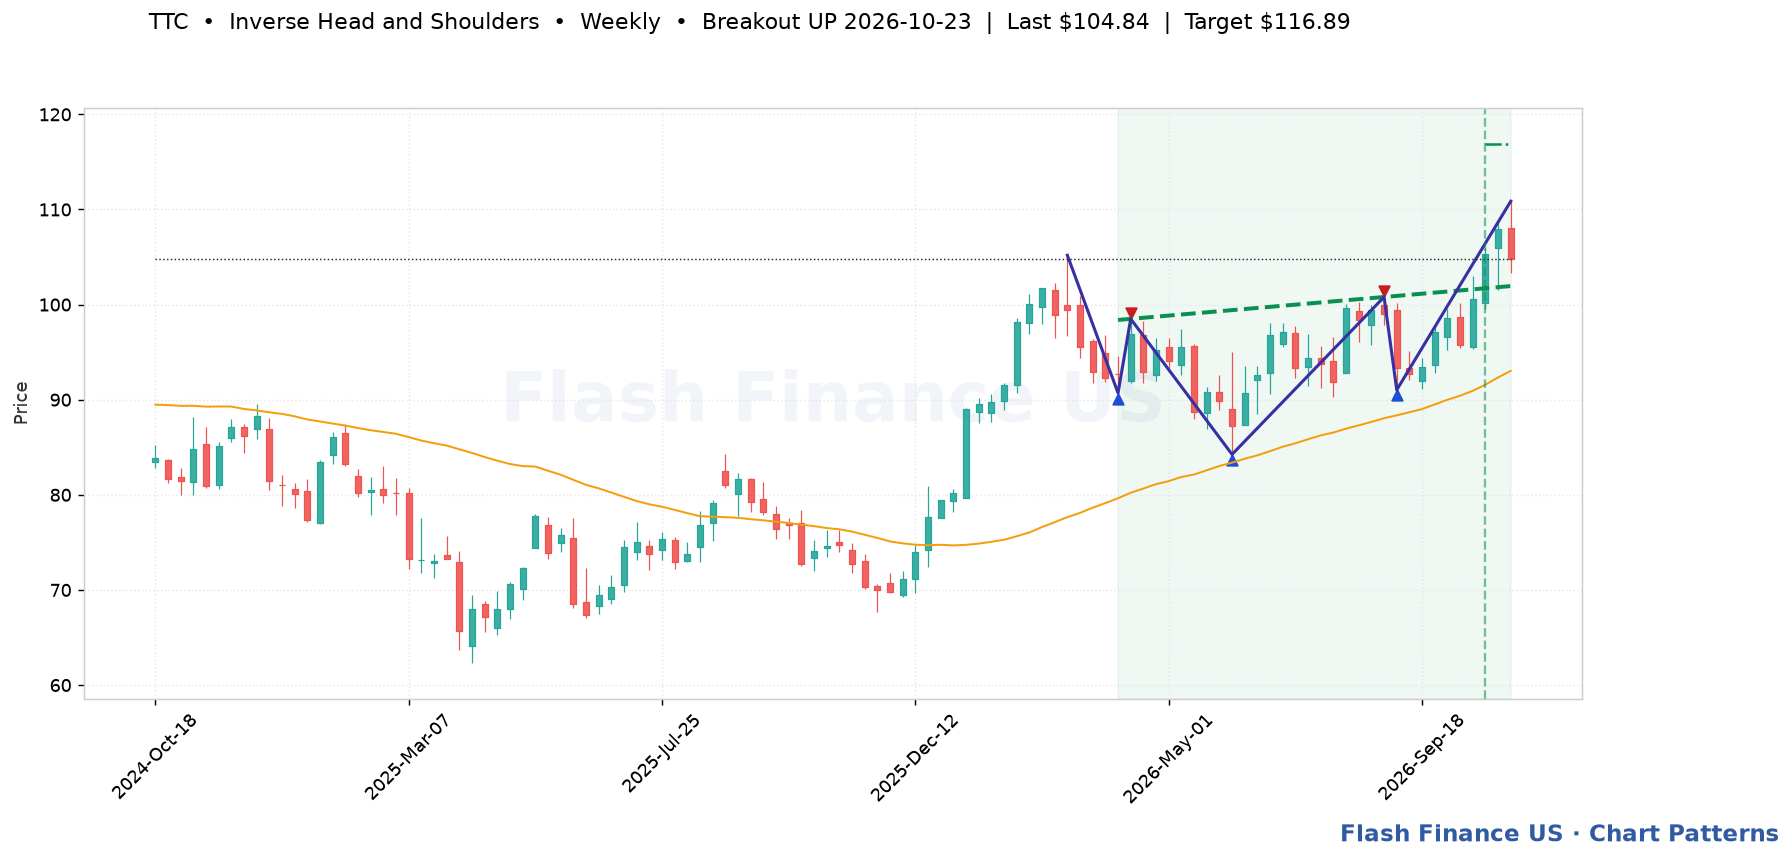
Last close$104.84
Break dateOct 23, 2026
Break level$101.72
Bars since break2
Break volume0.7x avg
Measured target$116.89 (+11.5%)
Pattern spanApr 02, 2026 → 31 bars
Touches5
Fit score100/100
Three troughs with the middle one deepest — the classic bottoming pattern. Trigger: A close above the neckline, ideally on rising volume. Invalidation: A close below the right shoulder, and certainly below the head.
Automated detection for education and research; not a recommendation. Levels are drawn from split-adjusted daily prices.