Chart pattern
VC chart pattern — Visteon
1 formation detected on the latest close (Nov 06, 2026).
Falling Wedge · Weekly candles
BullishForming
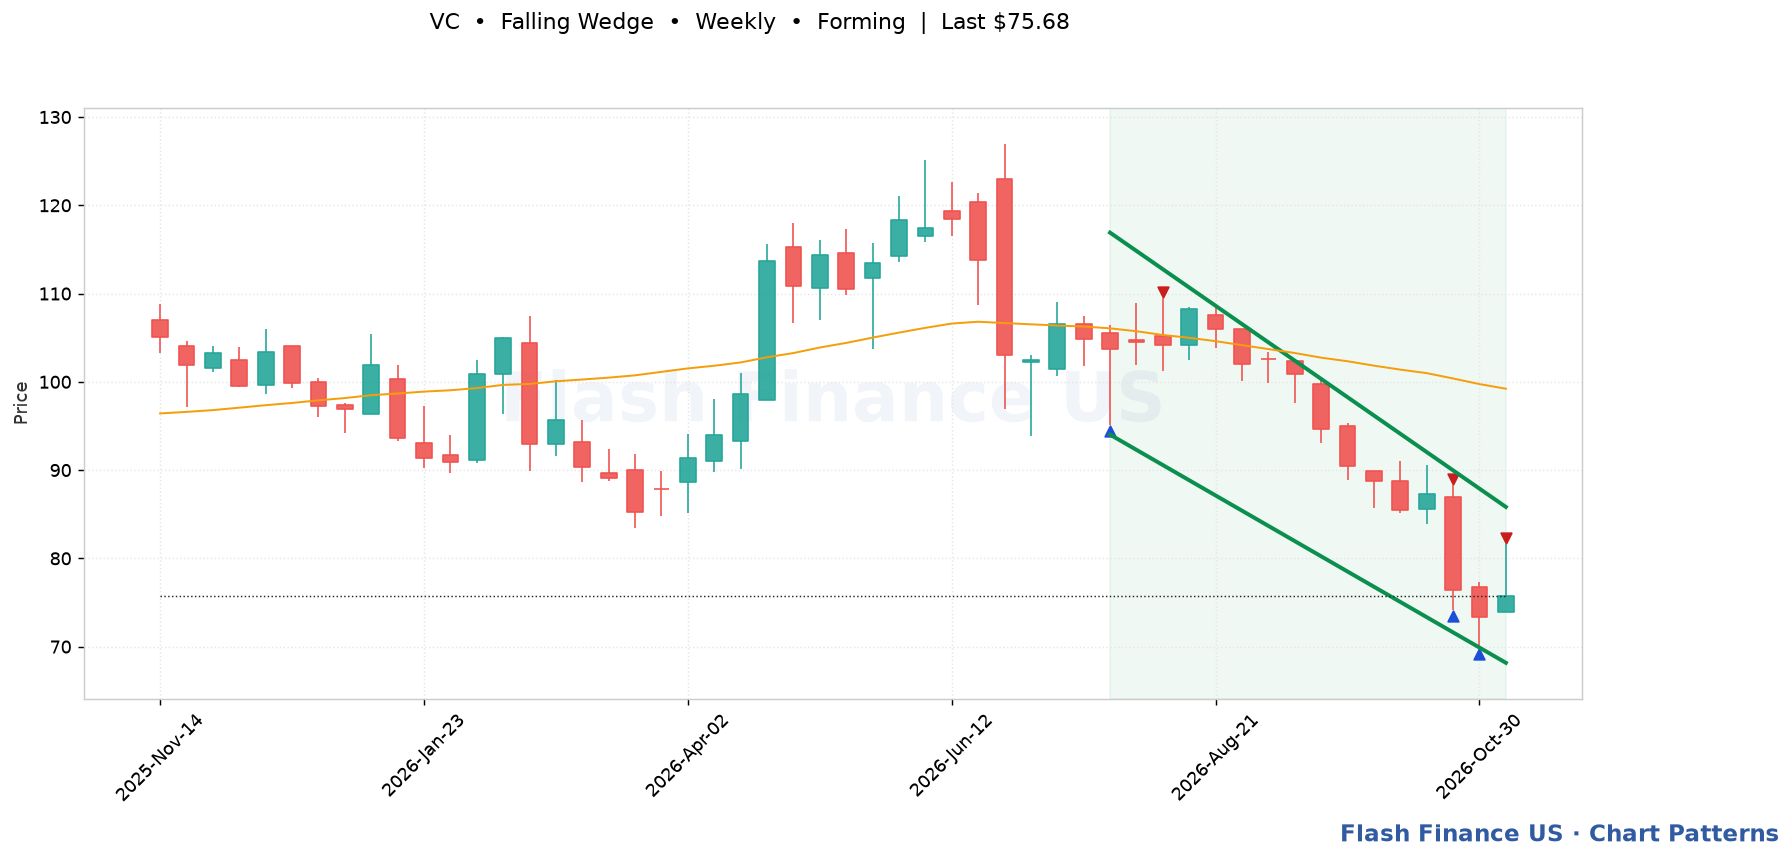
Last close$75.68
Trigger$85.83 (+13.4%)
Upper boundary$85.83
Lower boundary$68.17
Pattern spanJul 24, 2026 → 15 bars
Touches6
Fit score86/100
Price sliding lower inside two falling lines that are closing together — a decline losing its force. Trigger: A close above the falling upper boundary. Invalidation: A close below the lower boundary, which says the decline has reaccelerated rather than exhausted.
Automated detection for education and research; not a recommendation. Levels are drawn from split-adjusted daily prices.