Chart pattern
FOXA chart pattern — Fox Corporation (Class A)
1 formation detected on the latest close (Nov 09, 2026).
Rectangle / Trading Range · Weekly candles
NeutralForming
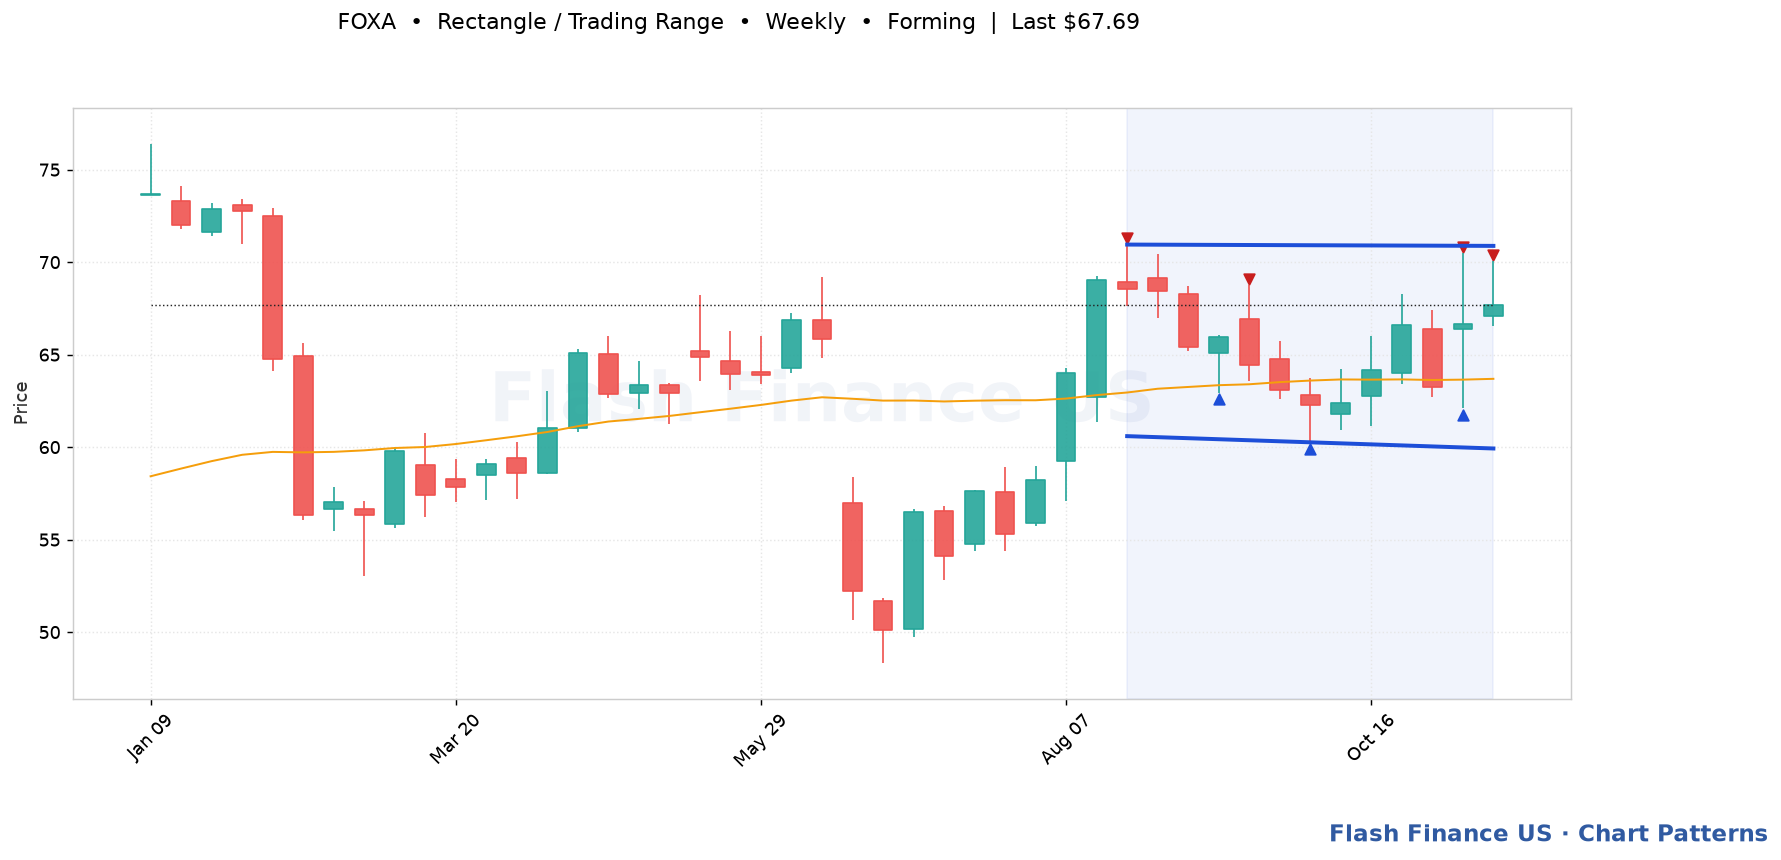
Last close$67.69
Trigger—
Upper boundary$70.88
Lower boundary$59.93
Pattern spanAug 21, 2026 → 12 bars
Touches7
Fit score84/100
A flat ceiling and a flat floor — price simply oscillating between two well-defended prices. Trigger: A close outside the box. The taller and better-tested the box, the more the break matters. Invalidation: Price re-entering the box after the break, which turns the move into a false breakout.
Automated detection for education and research; not a recommendation. Levels are drawn from split-adjusted daily prices.