KMB chart pattern — Kimberly-Clark
2 formations detected on the latest close (Nov 06, 2026).
Ascending Triangle · Daily candles

A flat ceiling with a rising floor — buyers paying up into the same resistance until it gives way. Trigger: A daily close above the flat resistance line, ideally on volume well above its recent average. Invalidation: A close back below the rising support line. Once the floor breaks, the pattern is void — the rising lows were the whole argument.
Double Top · Weekly candles
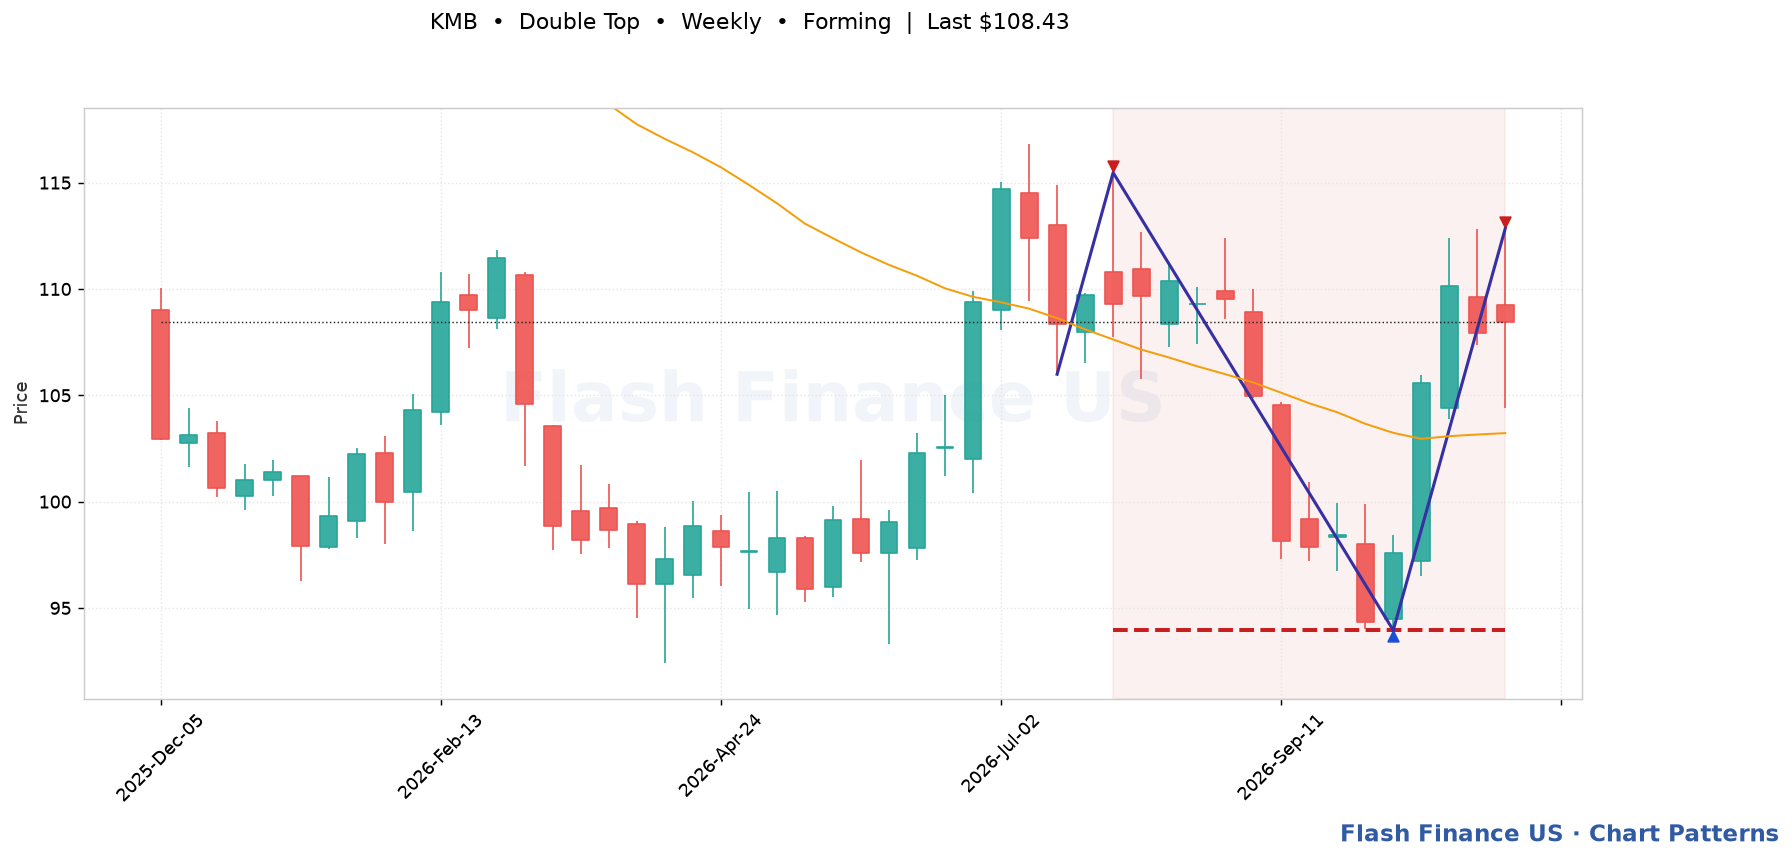
Two failed attempts at the same high, separated by a dip — the classic M. Trigger: A close below the neckline — the low between the two peaks. Until that happens it is just a pullback. Invalidation: A close above the twin peaks, which turns the whole thing into a base rather than a top.
Automated detection for education and research; not a recommendation. Levels are drawn from split-adjusted daily prices.