Continuation pattern · bullish
Ascending Triangle pattern: stocks showing it today
A flat ceiling with a rising floor — buyers paying up into the same resistance until it gives way.
Bullish31 stocks today
Example: PB weekly
Forming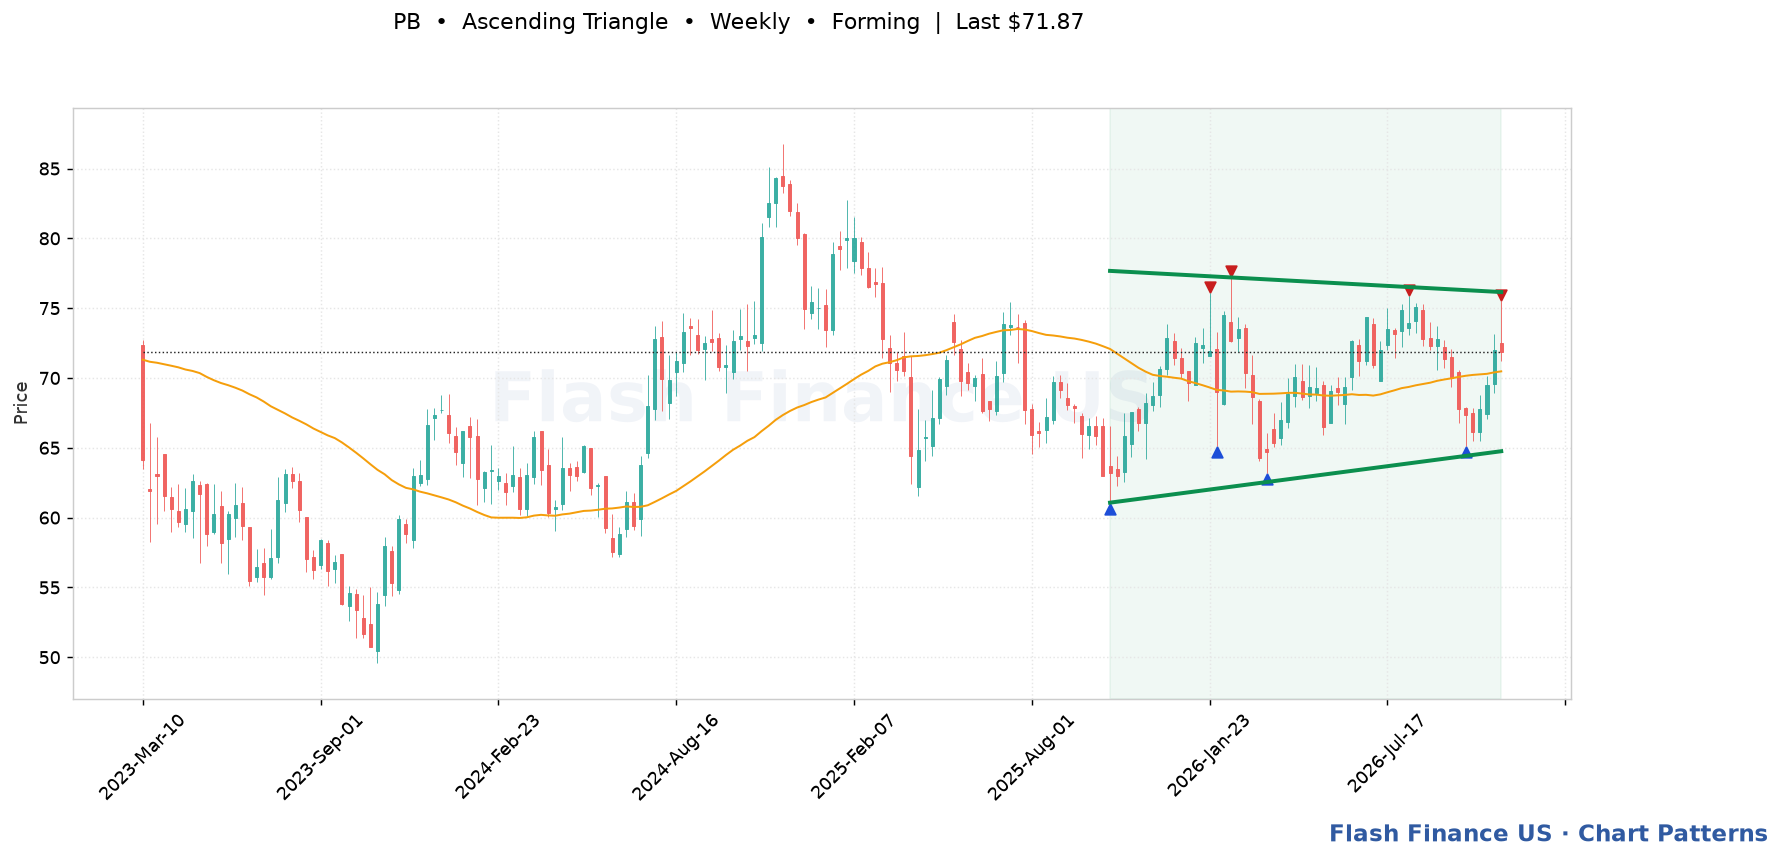
Stocks with an ascending triangle
| Stock | TF | State | Last | Trigger | Away | Target | Score |
|---|---|---|---|---|---|---|---|
| PBProsperity Bancshares | Weekly | Forming | $71.87 | $76.15 | +6.0% | — | 109 |
| EMNEastman Chemical | Daily | Forming | $64.41 | $68.98 | +7.1% | — | 106 |
| NATLNCR Atleos | Daily | Forming | $47.18 | $48.60 | +3.0% | — | 101 |
| NDSNNordson | Weekly | Forming | $309.86 | $338.23 | +9.2% | — | 93 |
| KMBKimberly-Clark | Daily | Forming | $108.43 | $112.87 | +4.1% | — | 92 |
| AIGAmerican International | Daily | Forming | $77.75 | $83.43 | +7.3% | — | 92 |
| SWXSouthwest Gas | Daily | Forming | $91.33 | $94.50 | +3.5% | — | 90 |
| IEXIDEX | Weekly | Forming | $226.99 | $240.76 | +6.1% | — | 88 |
| SJMJ.M. Smucker Company (The) | Daily | Forming | $130.55 | $136.21 | +4.3% | — | 88 |
| REXRRexford Industrial Realty | Weekly | Forming | $37.80 | $39.84 | +5.4% | — | 87 |
| DLBDolby | Weekly | Forming | $64.83 | $66.07 | +1.9% | — | 87 |
| CHCOCity Holding | Daily | Forming | $141.49 | $147.69 | +4.4% | — | 86 |
| RHPRyman Hospitality Properties | Weekly | Forming | $132.05 | $138.22 | +4.7% | — | 84 |
| WLYJohn Wiley & Sons | Daily | Forming | $50.23 | $54.16 | +7.8% | — | 78 |
| AFLAflac | Daily | Forming | $124.06 | $131.20 | +5.8% | — | 75 |
| ASBAssociated Bank | Weekly | Forming | $30.36 | $32.20 | +6.1% | — | 74 |
| NWBINorthwest Bancshares | Weekly | Forming | $15.24 | $16.07 | +5.4% | — | 74 |
| STBAS&T Bancorp | Weekly | Forming | $50.78 | $53.58 | +5.5% | — | 74 |
| WSFSWSFS Financial | Weekly | Forming | $78.94 | $83.30 | +5.5% | — | 74 |
| PRUPrudential Financial | Weekly | Forming | $119.24 | $128.78 | +8.0% | — | 73 |
| AWRAmerican States Water | Weekly | Forming | $89.98 | $91.93 | +2.2% | — | 73 |
| FULTFulton Financial | Weekly | Forming | $23.76 | $24.93 | +4.9% | — | 73 |
| HOMBHome BancShares | Weekly | Forming | $29.86 | $31.25 | +4.7% | — | 73 |
| ACTEnact Holdings | Weekly | Forming | $46.43 | $50.50 | +8.8% | — | 72 |
| ITWIllinois Tool Works | Weekly | Forming | $280.95 | $297.17 | +5.8% | — | 72 |
| NICNicolet Bankshares | Weekly | Forming | $173.12 | $179.70 | +3.8% | — | 72 |
| ABTAbbott Laboratories | Weekly | Forming | $109.93 | $117.07 | +6.5% | — | 72 |
| UGIUGI | Weekly | Forming | $37.04 | $39.32 | +6.2% | — | 71 |
| KIMKimco Realty | Weekly | Forming | $25.52 | $26.65 | +4.4% | — | 71 |
| SEICSEI Investments | Weekly | Forming | $105.30 | $112.15 | +6.5% | — | 68 |
| CVBFCVB Financial | Weekly | Forming | $22.74 | $23.95 | +5.3% | — | 65 |
Frequently asked questions
Is an ascending triangle bullish or bearish?
Bullish in most cases. It shows demand rising into fixed supply, and it resolves upward more often than downward. It is not a guarantee: an ascending triangle that breaks downward tends to fall quickly, because the rising lows leave no support underneath.
How long should an ascending triangle take to break out?
Most resolve within the last third of the pattern, before the lines actually meet. A triangle that drifts all the way to the apex without breaking has usually lost the momentum that made it worth watching.
What confirms an ascending triangle breakout?
A close beyond the flat resistance rather than an intraday poke, expanding volume on the breakout bar, and price holding above the old resistance if it comes back to retest it.