Chart pattern
WSFS chart pattern — WSFS Financial
1 formation detected on the latest close (Nov 09, 2026).
Ascending Triangle · Weekly candles
BullishForming
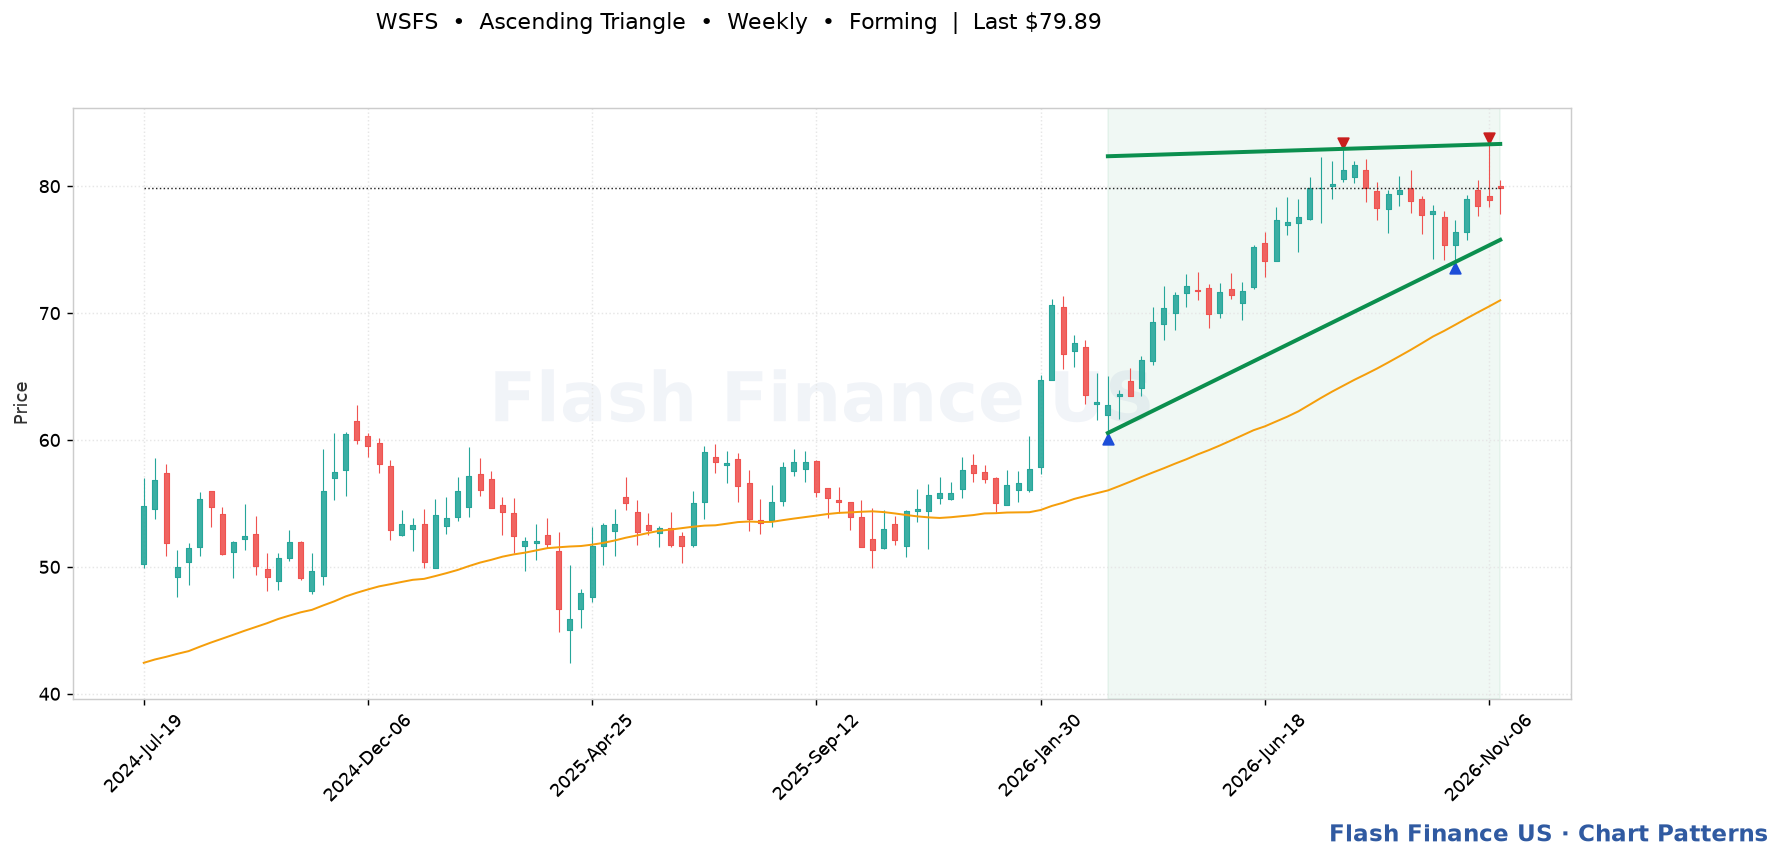
Last close$79.89
Trigger$83.33 (+4.3%)
Upper boundary$83.33
Lower boundary$75.77
Pattern spanMar 13, 2026 → 35 bars
Touches4
Fit score74/100
A flat ceiling with a rising floor — buyers paying up into the same resistance until it gives way. Trigger: A daily close above the flat resistance line, ideally on volume well above its recent average. Invalidation: A close back below the rising support line. Once the floor breaks, the pattern is void — the rising lows were the whole argument.
Automated detection for education and research; not a recommendation. Levels are drawn from split-adjusted daily prices.