Reversal pattern · bearish
Head and Shoulders pattern: stocks showing it today
Three peaks with the middle one highest — the best known topping pattern there is.
Bearish58 stocks today
Example: NSSC weekly
▼ Broken down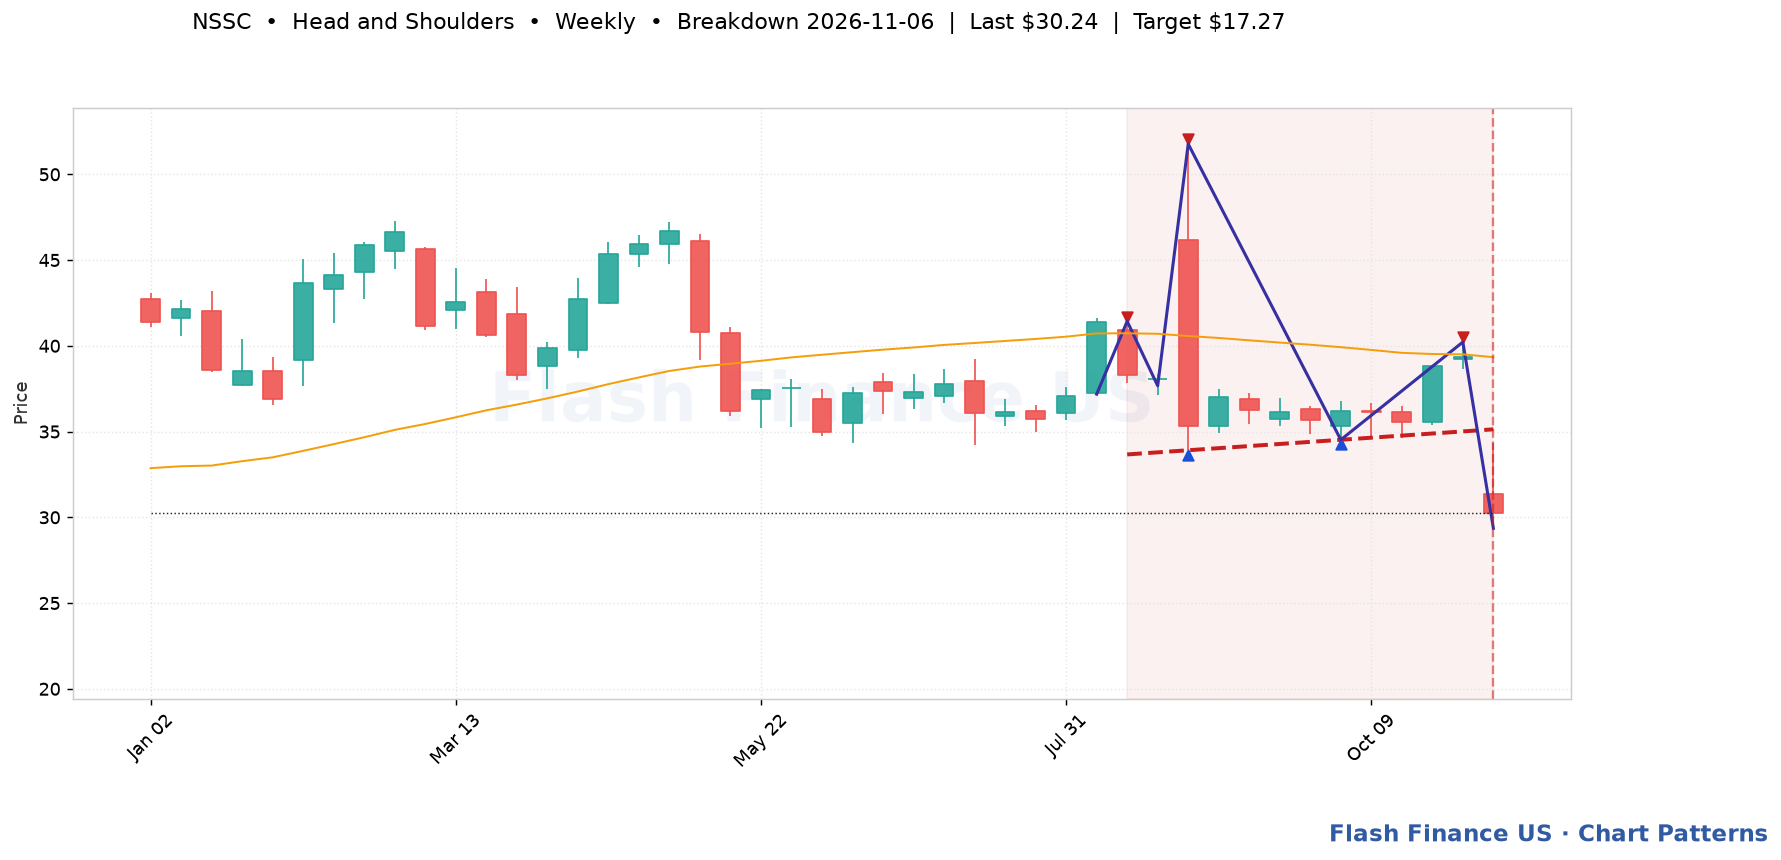
Stocks with a head and shoulders
| Stock | TF | State | Last | Trigger | Away | Target | Score |
|---|---|---|---|---|---|---|---|
| NSSCNapco Security Technologies | Weekly | ▼ Broken down | $30.24 | $35.13 | Nov 06 | $17.27 (-43%) | 105 |
| GTYGetty Realty | Weekly | ▼ Broken down | $28.56 | $29.61 | Sep 25 | $22.39 (-22%) | 104 |
| NEUNewMarket | Weekly | ▼ Broken down | $694.31 | $769.42 | Nov 06 | $557.18 (-20%) | 100 |
| IDAIdacorp | Daily | Forming | $146.55 | $126.06 | -14.0% | — | 93 |
| REGRegency Centers | Weekly | Forming | $74.84 | $70.72 | -5.5% | — | 91 |
| PFSProvident Financial Services | Daily | Forming | $22.96 | $21.14 | -7.9% | — | 90 |
| PPLPPL | Weekly | Forming | $35.80 | $31.32 | -12.5% | — | 90 |
| IVTInvenTrust Properties | Weekly | Forming | $31.51 | $29.14 | -7.5% | — | 90 |
| BRXBrixmor Property | Weekly | Forming | $30.02 | $24.66 | -17.9% | — | 90 |
| NINiSource | Weekly | Forming | $44.15 | $38.13 | -13.6% | — | 90 |
| PAGPenske Automotive | Daily | Forming | $212.36 | $191.96 | -9.6% | — | 90 |
| INVHInvitation Homes | Weekly | Forming | $27.10 | $24.25 | -10.5% | — | 89 |
| ABCBAmeris Bancorp | Weekly | Forming | $81.79 | $77.57 | -5.2% | — | 88 |
| CPTCamden Property Trust | Weekly | Forming | $99.44 | $95.12 | -4.3% | — | 88 |
| PFSProvident Financial Services | Weekly | Forming | $22.96 | $19.89 | -13.4% | — | 88 |
| UDRUDR | Weekly | Forming | $36.58 | $33.04 | -9.7% | — | 88 |
| BANCBanc Of California | Weekly | Forming | $17.98 | $16.78 | -6.7% | — | 88 |
| FHBFirst Hawaiian | Weekly | Forming | $24.98 | $24.18 | -3.2% | — | 88 |
| PECOPhillips Edison & | Weekly | Forming | $40.56 | $36.62 | -9.7% | — | 88 |
| CURBCurbline Properties | Weekly | Forming | $29.38 | $25.75 | -12.4% | — | 88 |
| HRHealthcare Realty Trust | Weekly | Forming | $19.20 | $16.84 | -12.3% | — | 88 |
| KRGKite Realty Group Trust | Weekly | Forming | $25.45 | $23.67 | -7.0% | — | 88 |
| OPLNOPENLANE | Daily | Forming | $34.35 | $34.04 | -0.9% | — | 87 |
| MTBM&T Bank | Weekly | Forming | $217.75 | $213.93 | -1.8% | — | 87 |
| AUBAtlantic Union Bankshares | Weekly | Forming | $39.34 | $36.94 | -6.1% | — | 87 |
| BACBank of America | Weekly | Forming | $49.42 | $49.25 | -0.3% | — | 87 |
| FFINFirst Financial Bankshares | Weekly | Forming | $30.41 | $29.47 | -3.1% | — | 87 |
| CFGCitizens Financial | Weekly | Forming | $63.24 | $62.29 | -1.5% | — | 87 |
| KEYKeyCorp | Weekly | Forming | $20.85 | $19.27 | -7.6% | — | 87 |
| PNCPNC Financial Services | Weekly | Forming | $225.38 | $208.33 | -7.6% | — | 87 |
| SNASnap-on | Weekly | Forming | $367.22 | $328.86 | -10.4% | — | 87 |
| LLoews | Weekly | Forming | $109.71 | $104.40 | -4.8% | — | 87 |
| RFRegions Financial | Weekly | Forming | $28.31 | $26.13 | -7.7% | — | 87 |
| GBCIGlacier Bancorp | Weekly | Forming | $48.16 | $42.19 | -12.4% | — | 87 |
| PRIPrimerica | Weekly | Forming | $290.58 | $252.63 | -13.1% | — | 87 |
| AATAmerican Assets Trust | Weekly | Forming | $21.53 | $20.35 | -5.5% | — | 87 |
| OHIOmega Healthcare Investors | Weekly | Forming | $48.19 | $43.52 | -9.7% | — | 87 |
| CVXChevron | Daily | Forming | $212.61 | $212.98 | +0.2% | — | 87 |
| EOGEOG Resources | Daily | Forming | $147.13 | $137.35 | -6.6% | — | 87 |
| RMDResMed | Daily | Forming | $235.30 | $222.08 | -5.6% | — | 87 |
| XOMExxonMobil | Daily | Forming | $165.87 | $165.43 | -0.3% | — | 87 |
| CBUCommunity Bank System | Weekly | Forming | $64.74 | $56.34 | -13.0% | — | 86 |
| HIWHighwoods Properties | Weekly | Forming | $31.47 | $28.39 | -9.8% | — | 86 |
| PFGCPerformance Food | Weekly | Forming | $107.50 | $88.95 | -17.3% | — | 86 |
| SKTTanger Factory Outlet Centers | Weekly | Forming | $38.70 | $34.01 | -12.1% | — | 86 |
| UMBFUMB Financial | Weekly | Forming | $133.77 | $125.71 | -6.0% | — | 86 |
| OXYOccidental Petroleum | Daily | Forming | $56.38 | $56.61 | +0.4% | — | 86 |
| CDPCOPT Defense Properties | Weekly | Forming | $32.87 | $32.64 | -0.7% | — | 86 |
| COFCapital One | Weekly | Forming | $201.87 | $189.11 | -6.3% | — | 86 |
| DOCHealthpeak Properties | Weekly | Forming | $20.26 | $18.27 | -9.8% | — | 86 |
| FERGFerguson Enterprises | Weekly | Forming | $233.70 | $208.63 | -10.7% | — | 86 |
| ZWSZurn Elkay Water Solutions | Weekly | Forming | $43.47 | $42.89 | -1.3% | — | 86 |
| GPORGulfport Energy | Weekly | Forming | $150.00 | $149.79 | -0.1% | — | 86 |
| BMYBristol Myers Squibb | Weekly | Forming | $62.14 | $56.00 | -9.9% | — | 86 |
| CNRCore Natural Resources | Weekly | Forming | $79.31 | $77.50 | -2.3% | — | 86 |
| IVZInvesco | Weekly | Forming | $27.08 | $26.99 | -0.3% | — | 86 |
| RTXRTX | Weekly | Forming | $189.53 | $175.02 | -7.7% | — | 86 |
| FTITechnipFMC | Weekly | Forming | $63.52 | $63.26 | -0.4% | — | 86 |
Frequently asked questions
What does a head and shoulders pattern indicate?
A likely end to an uptrend. It is a reversal pattern, and it is confirmed only when price closes below the neckline — an unconfirmed head and shoulders fails often enough that trading it early is a losing habit.
Does the neckline have to be horizontal?
No. The two troughs are rarely at the same price, so the neckline usually slopes. A down-sloping neckline is generally read as more bearish. Flash Finance draws the neckline through both troughs rather than flattening it to an average.
What is an inverse head and shoulders?
The same shape upside down — a low, a lower low, then a higher low — and it is a bullish bottoming pattern instead of a bearish topping one.