Chart pattern
NSSC chart pattern — Napco Security Technologies
1 formation detected on the latest close (Nov 06, 2026).
Head and Shoulders · Weekly candles
Bearish▼ Broken down
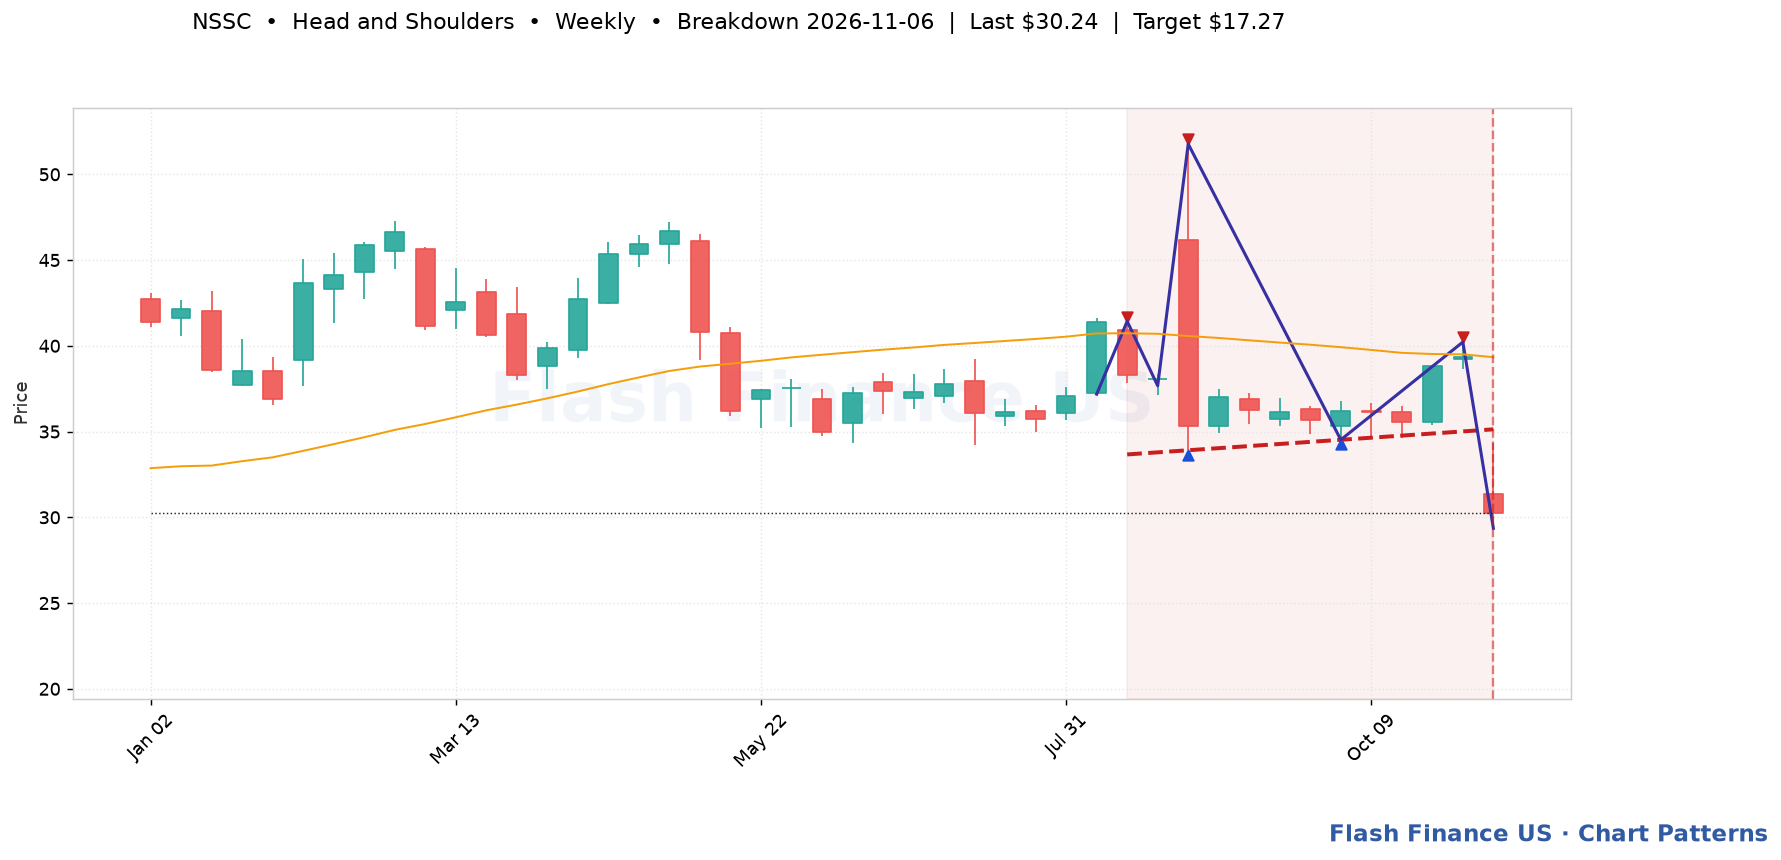
Last close$30.24
Break dateNov 06, 2026
Break level$35.13
Bars since break0
Break volume2.8x avg ✓
Measured target$17.27 (-42.9%)
Pattern spanAug 14, 2026 → 12 bars
Touches5
Fit score105/100
Three peaks with the middle one highest — the best known topping pattern there is. Trigger: A close below the neckline. A right shoulder alone is not a signal. Invalidation: A close above the right shoulder before the neckline breaks, and above the head at any point.
Automated detection for education and research; not a recommendation. Levels are drawn from split-adjusted daily prices.