Continuation pattern · bearish
Descending Triangle pattern: stocks showing it today
A flat floor with a falling ceiling — sellers accepting less each time until the support gives way.
Bearish25 stocks today
Example: PLD daily
Forming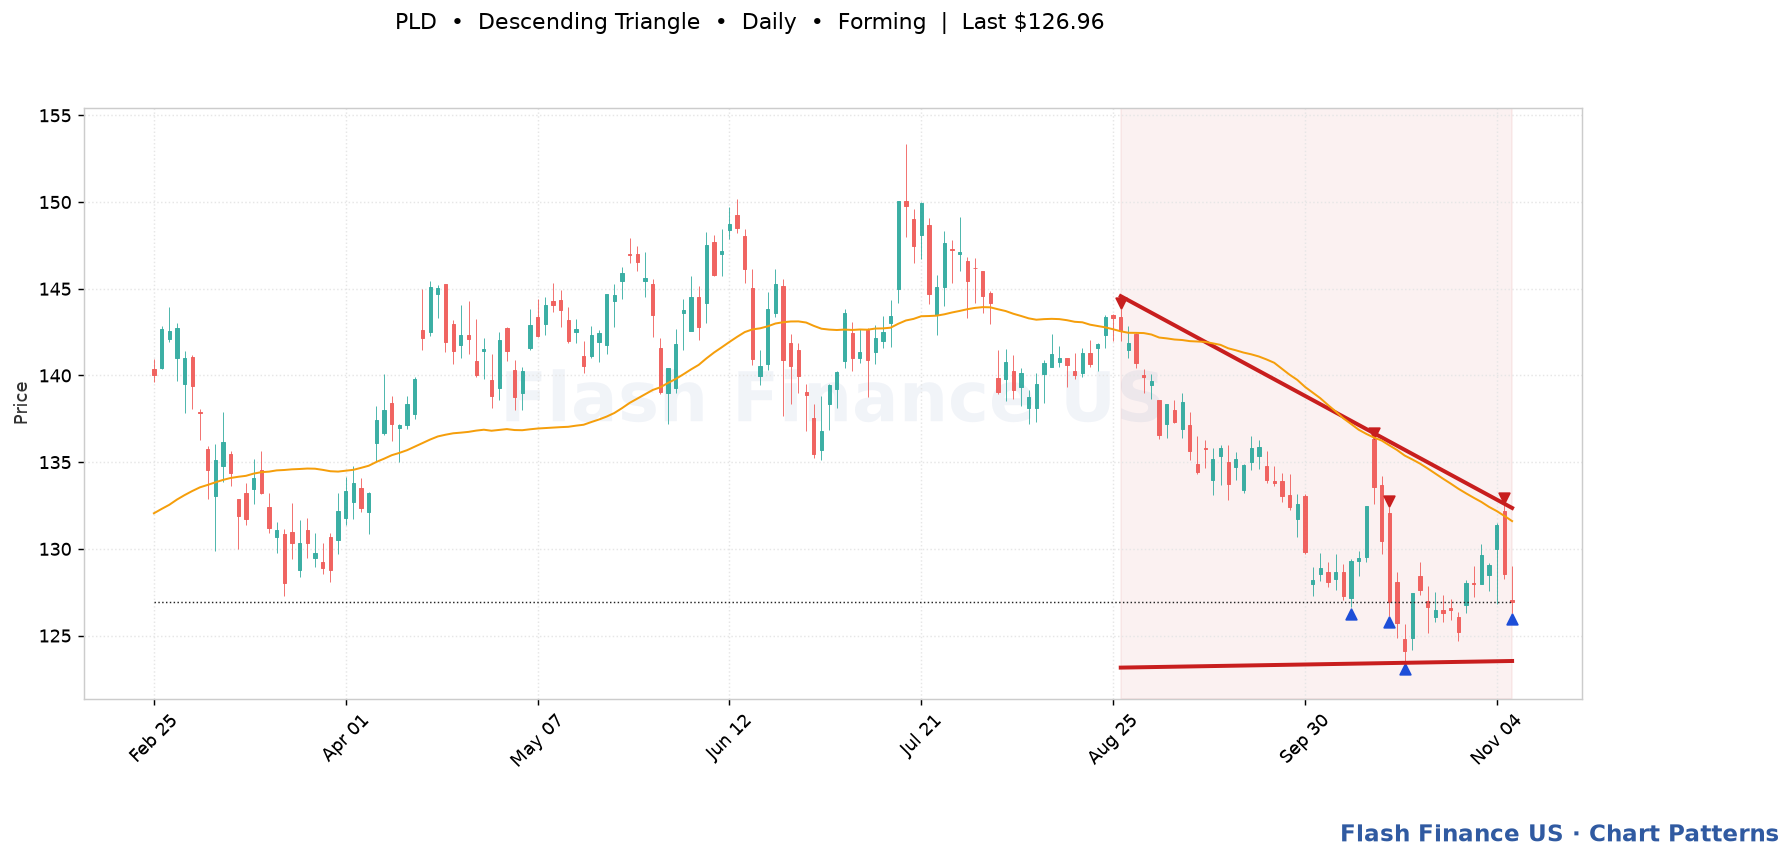
Stocks with a descending triangle
| Stock | TF | State | Last | Trigger | Away | Target | Score |
|---|---|---|---|---|---|---|---|
| PLDPrologis | Daily | Forming | $126.96 | $123.53 | -2.7% | — | 106 |
| GRMNGarmin | Weekly | Forming | $285.57 | $260.88 | -8.6% | — | 97 |
| FEFirstEnergy | Weekly | Forming | $46.43 | $42.52 | -8.4% | — | 95 |
| NFGNational Fuel Gas | Weekly | Forming | $73.43 | $73.43 | +0.0% | — | 91 |
| NBHCNational Bank Holdings | Daily | Forming | $36.91 | $36.88 | -0.1% | — | 91 |
| WTSWatts Water Technologies | Weekly | Forming | $346.14 | $329.25 | -4.9% | — | 91 |
| ORIOld Republic International | Weekly | Forming | $39.61 | $37.20 | -6.1% | — | 88 |
| FBPFirst BanCorp (Puerto Rico) | Daily | Forming | $26.00 | $25.87 | -0.5% | — | 87 |
| BANFBancfirst | Weekly | Forming | $115.20 | $103.44 | -10.2% | — | 86 |
| EXEExpand Energy | Weekly | Forming | $84.60 | $82.99 | -1.9% | — | 86 |
| HBANHuntington Bancshares | Weekly | Forming | $15.47 | $14.81 | -4.3% | — | 81 |
| CRUSCirrus Logic | Weekly | Forming | $113.58 | $104.52 | -8.0% | — | 79 |
| INVHInvitation Homes | Daily | Forming | $27.10 | $25.82 | -4.7% | — | 75 |
| LINLinde | Weekly | Forming | $515.25 | $456.49 | -11.4% | — | 74 |
| MDUMDU Resources Group | Daily | Forming | $18.63 | $18.12 | -2.7% | — | 74 |
| DDominion Energy | Weekly | Forming | $68.60 | $59.50 | -13.3% | — | 74 |
| GLPIGaming and Leisure Properties | Daily | Forming | $38.89 | $37.33 | -4.0% | — | 73 |
| HFWAHeritage Financial | Weekly | Forming | $28.39 | $26.67 | -6.0% | — | 73 |
| SUISun Communities | Daily | Forming | $120.30 | $110.02 | -8.5% | — | 72 |
| PAGPenske Automotive | Weekly | Forming | $212.36 | $192.00 | -9.6% | — | 72 |
| EGPEastGroup Properties | Weekly | Forming | $193.81 | $189.97 | -2.0% | — | 70 |
| SRESempra | Weekly | Forming | $78.17 | $76.21 | -2.5% | — | 65 |
| CBSHCommerce Bancshares | Daily | Forming | $55.04 | $53.49 | -2.8% | — | 64 |
| CPTCamden Property Trust | Daily | Forming | $99.44 | $95.30 | -4.2% | — | 62 |
| MRTNMarten Transport | Weekly | Forming | $11.74 | $10.94 | -6.8% | — | 57 |
Frequently asked questions
Is a descending triangle always bearish?
It leans bearish, and that is how it is usually traded, but it is not a rule. In a strong uptrend a descending triangle often resolves upward as a pause rather than a top. The flat support breaking is what makes it bearish, not the shape alone.
What is the difference between a descending triangle and a falling wedge?
A descending triangle has a FLAT lower boundary and a falling upper one. A falling wedge has BOTH boundaries falling, with the upper falling faster. The descending triangle is bearish; the falling wedge is usually bullish.
How reliable is a descending triangle?
It is more reliable when the flat support has been tested at least three times and the breakdown comes on heavy volume. A break on thin volume is often recovered within a few sessions.