Chart pattern
LMAT chart pattern — LeMaitre Vascular
1 formation detected on the latest close (Nov 10, 2026).
Descending Triangle · Weekly candles
BearishForming
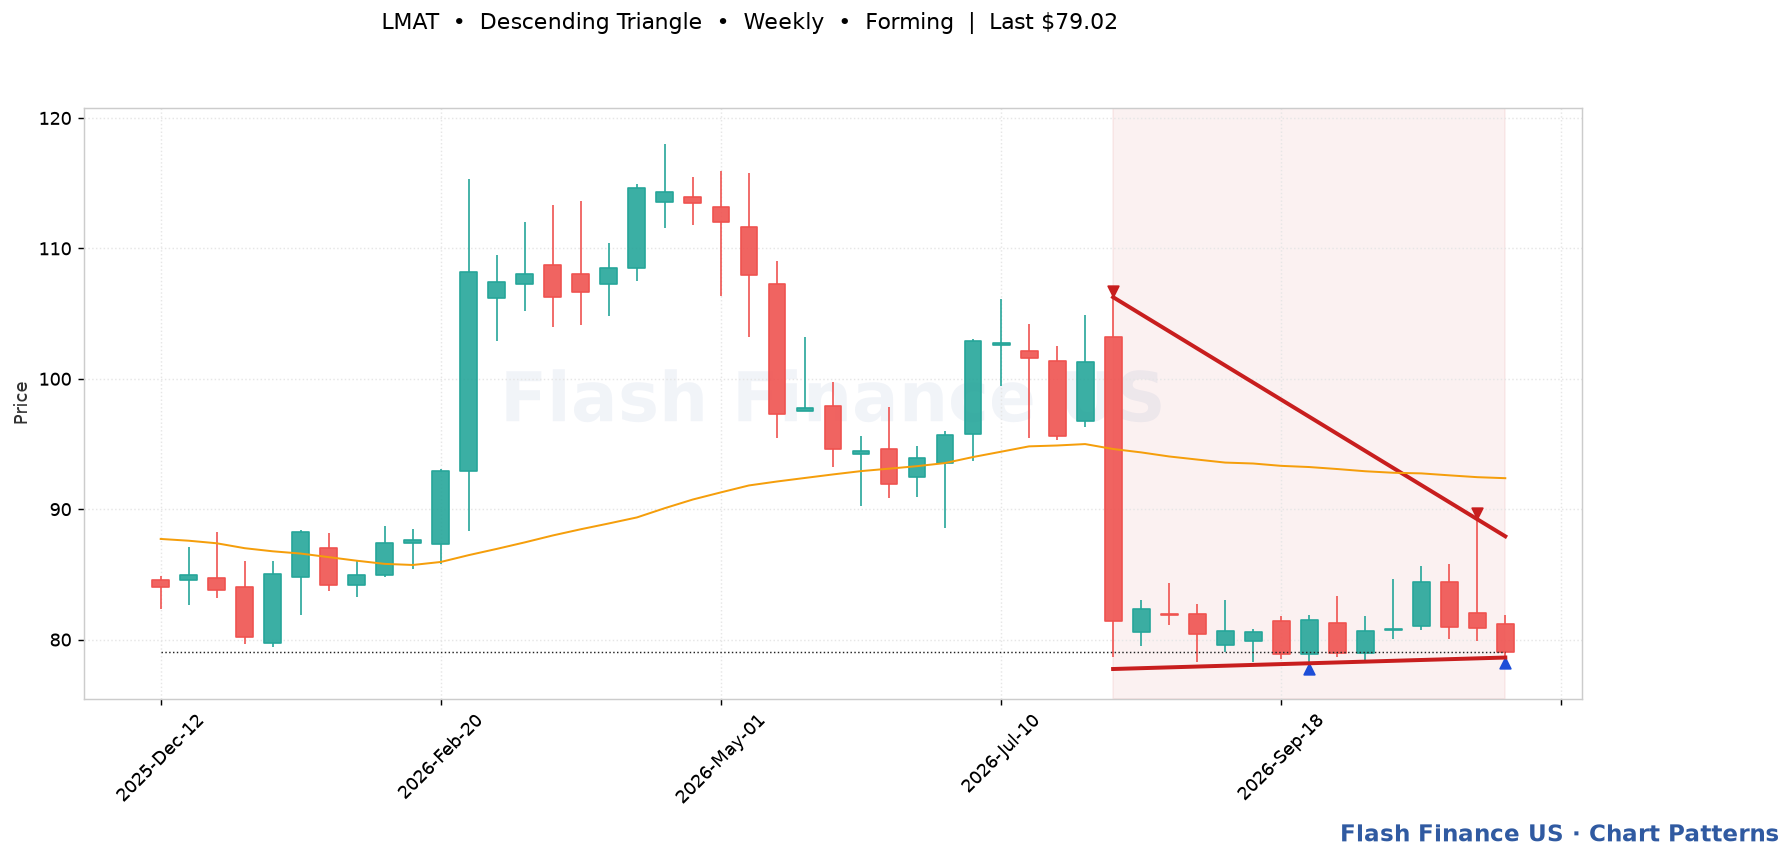
Last close$79.02
Trigger$78.62 (-0.5%)
Upper boundary$87.92
Lower boundary$78.62
Pattern spanAug 07, 2026 → 14 bars
Touches4
Fit score72/100
A flat floor with a falling ceiling — sellers accepting less each time until the support gives way. Trigger: A daily close below the flat support line, usually with a clear pickup in volume. Invalidation: A close back above the falling resistance line, which says the sequence of lower highs has ended.
Automated detection for education and research; not a recommendation. Levels are drawn from split-adjusted daily prices.