Chart pattern
MS chart pattern — Morgan Stanley
1 formation detected on the latest close (Nov 16, 2026).
Bear Flag · Weekly candles
BearishForming
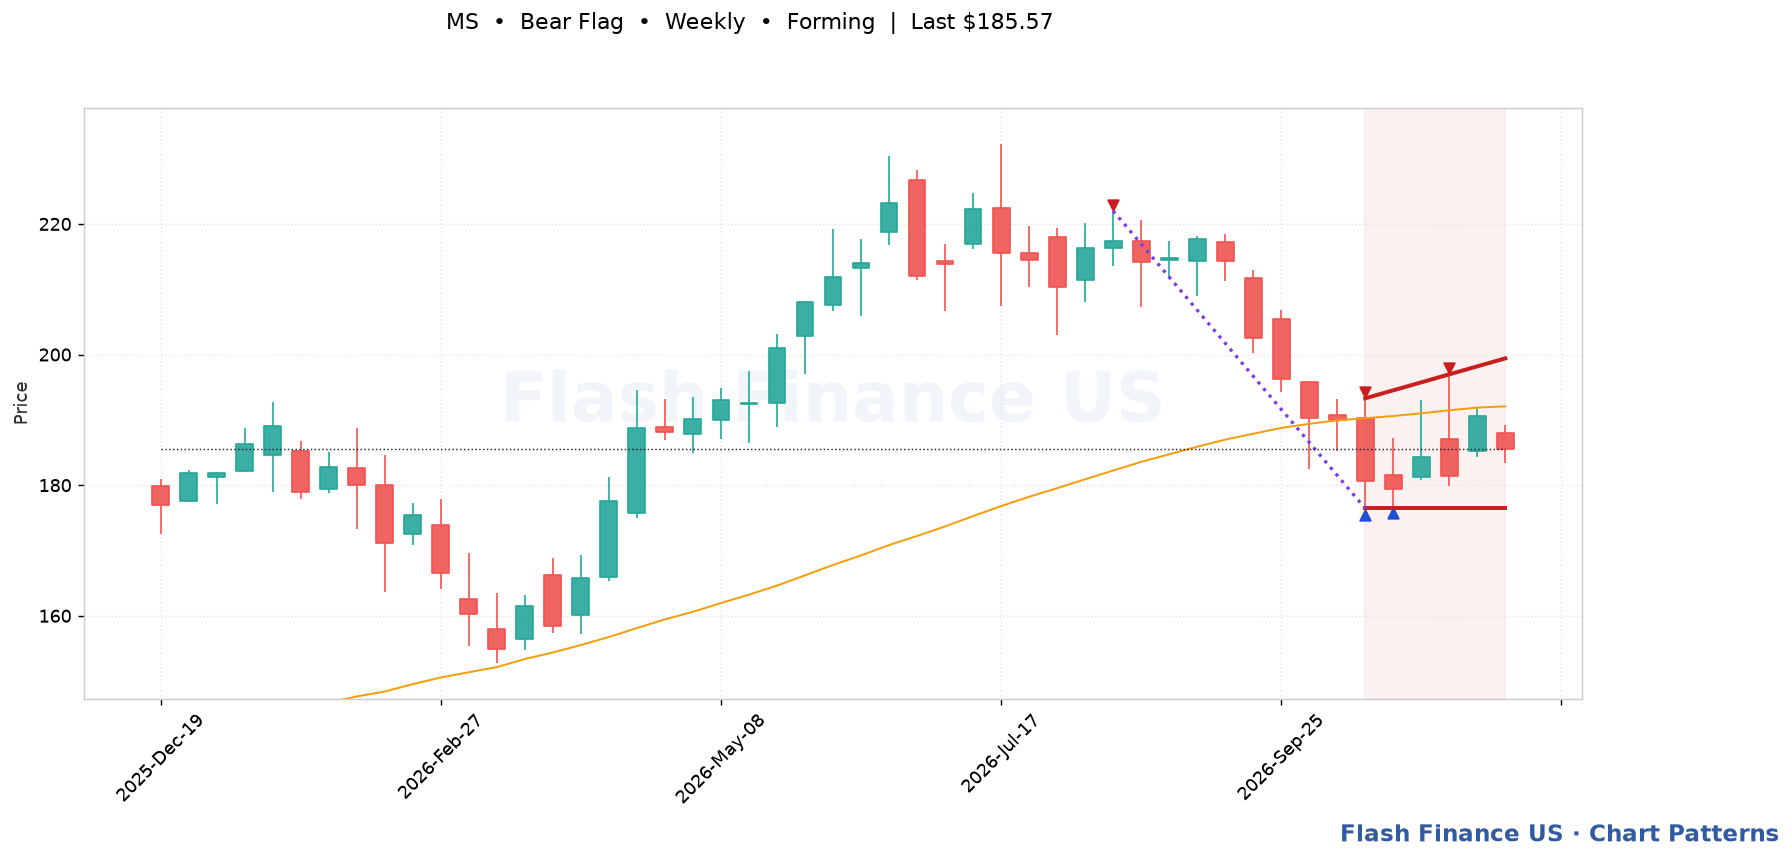
Last close$185.57
Trigger$176.44 (-4.9%)
Upper boundary$199.42
Lower boundary$176.44
Pattern spanAug 14, 2026 → 14 bars
Touches5
Fit score78/100
A sharp decline, then a tight drift higher — a downtrend pausing before it resumes. Trigger: A close below the flag's lower boundary. Invalidation: A bounce that recovers much more than half the pole, or a close above the flag's upper boundary.
Automated detection for education and research; not a recommendation. Levels are drawn from split-adjusted daily prices.