Chart pattern
SBAC chart pattern — SBA Communications
2 formations detected on the latest close (Nov 06, 2026).
Inverse Head and Shoulders · Weekly candles
BullishForming
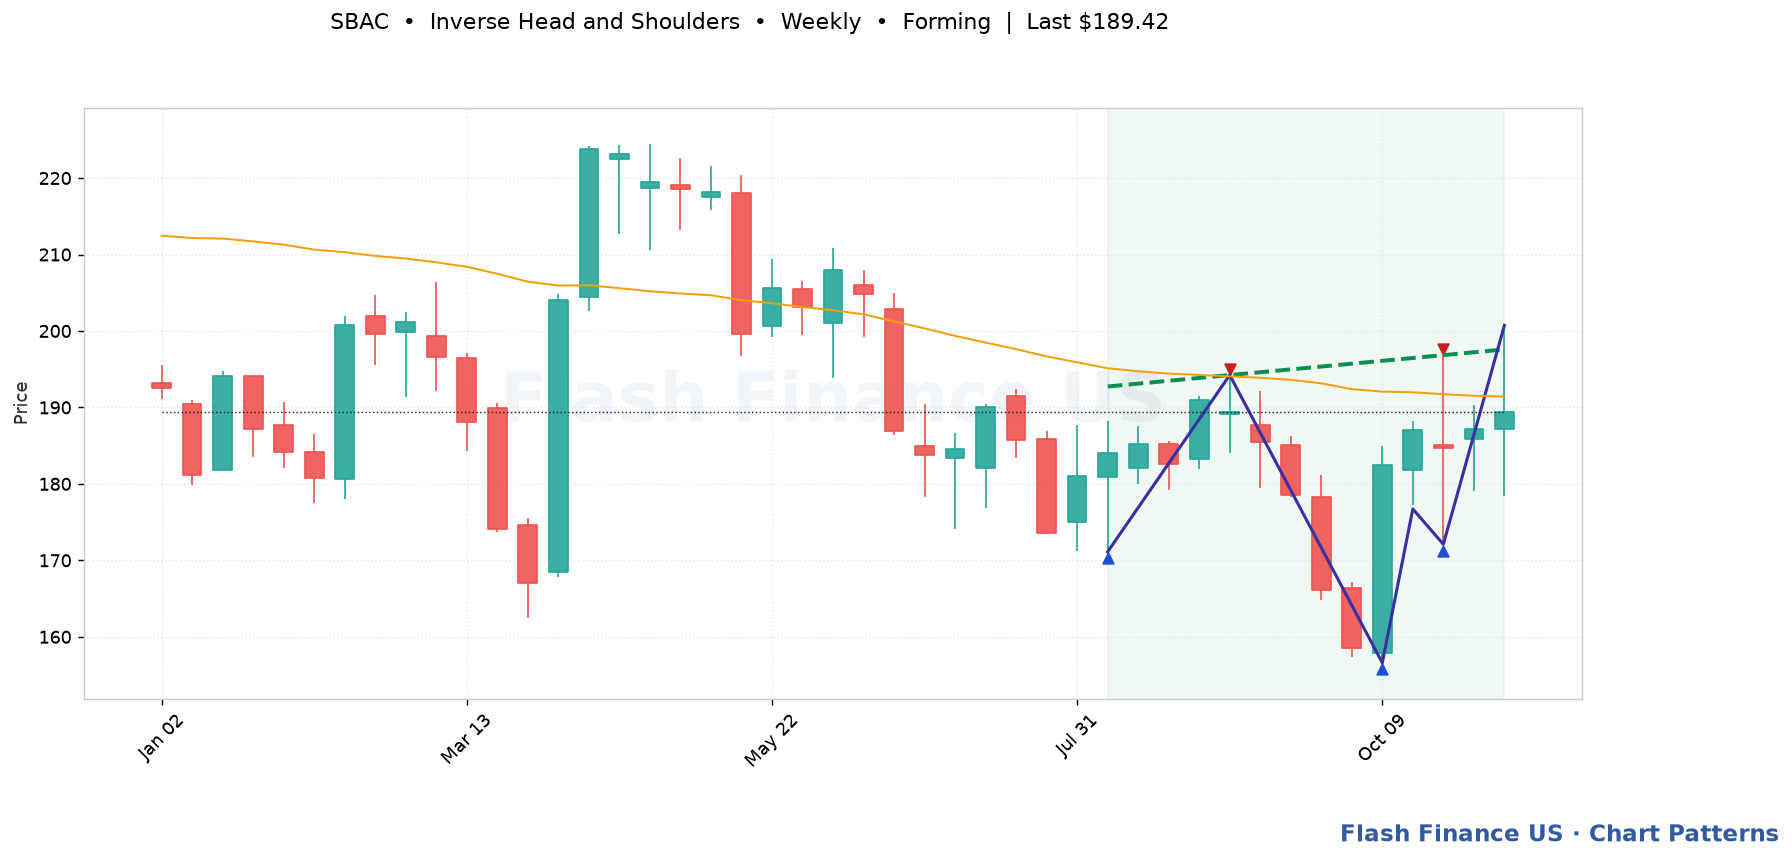
Last close$189.42
Trigger$197.59 (+4.3%)
Pattern spanAug 07, 2026 → 13 bars
Touches5
Fit score85/100
Three troughs with the middle one deepest — the classic bottoming pattern. Trigger: A close above the neckline, ideally on rising volume. Invalidation: A close below the right shoulder, and certainly below the head.
Cup and Handle · Daily candles
BullishForming

Last close$189.42
Trigger$197.59 (+4.3%)
Pattern spanSep 03, 2026 → 45 bars
Touches4
Fit score75/100
A rounded base followed by a shallow drift — a long consolidation that resolves upward. Trigger: A close above the rim, which is the high on either side of the cup. Invalidation: A handle that retraces more than about a third of the cup, or a close below the handle's low.
Automated detection for education and research; not a recommendation. Levels are drawn from split-adjusted daily prices.