Chart pattern
WPC chart pattern — W. P. Carey
2 formations detected on the latest close (Nov 06, 2026).
Triple Top · Weekly candles
Bearish▼ Broken down
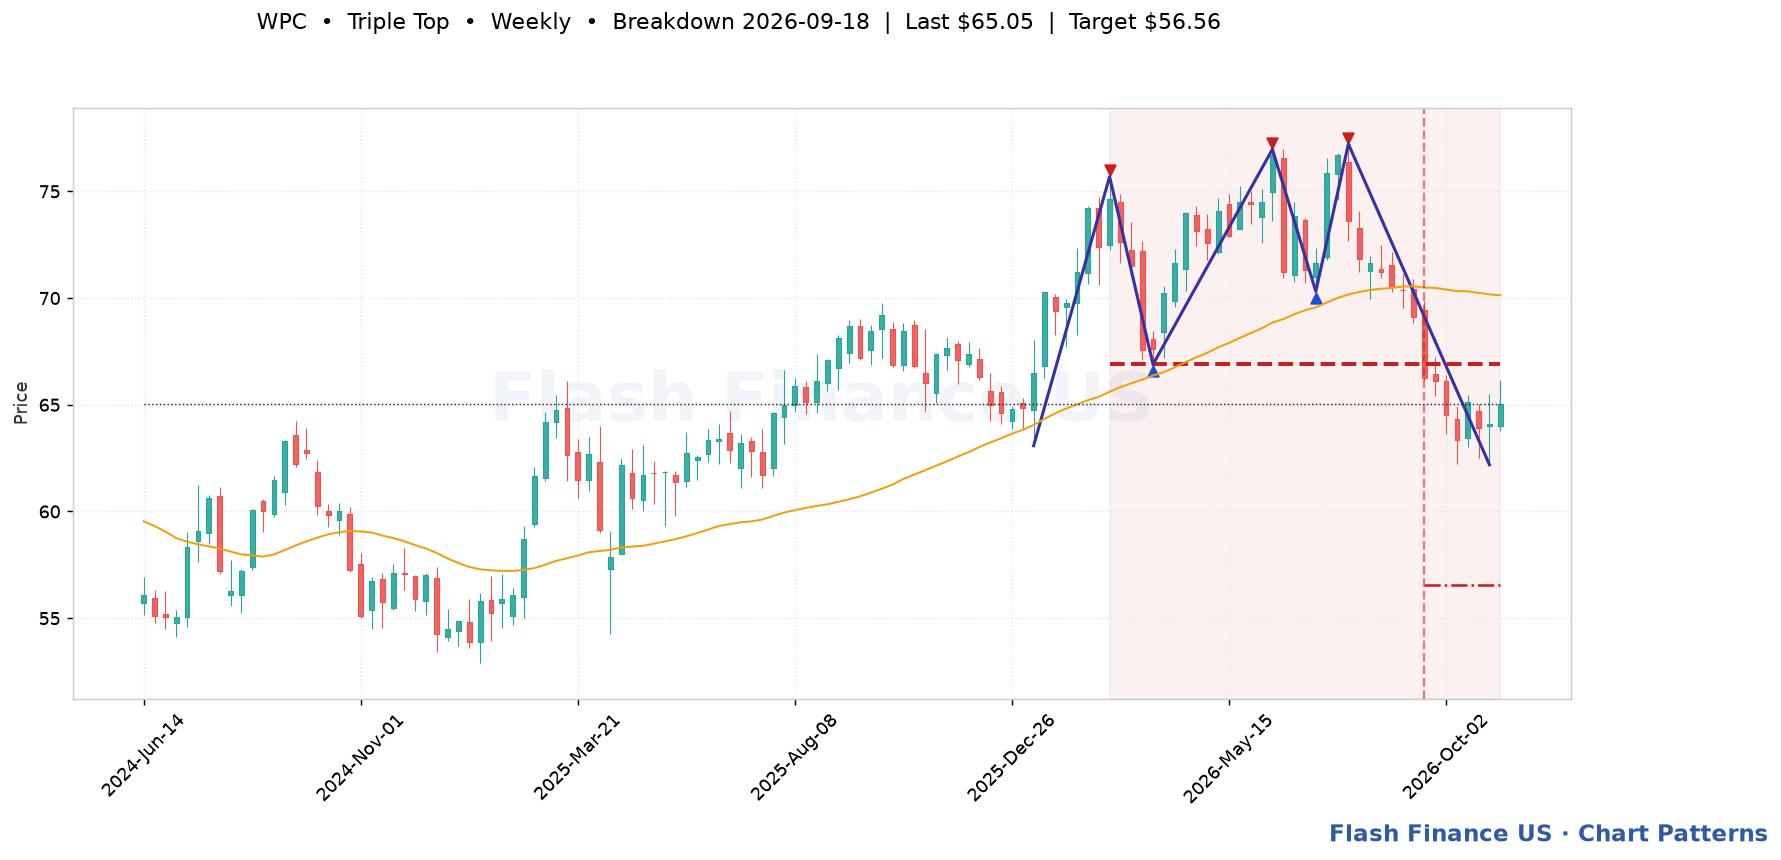
Last close$65.05
Break dateSep 18, 2026
Break level$66.89
Bars since break7
Break volume1.6x avg ✓
Measured target$56.56 (-13.1%)
Pattern spanFeb 27, 2026 → 36 bars
Touches5
Fit score101/100
Three failed attempts at the same high — heavier supply than a double top. Trigger: A close below the neckline drawn through the intervening lows. Invalidation: A close above the three peaks — a level tested three times and then cleared is a strong bullish signal.
Bear Flag · Daily candles
BearishForming

Last close$65.05
Trigger$62.16 (-4.4%)
Upper boundary$66.23
Lower boundary$62.16
Pattern spanJul 28, 2026 → 72 bars
Touches5
Fit score81/100
A sharp decline, then a tight drift higher — a downtrend pausing before it resumes. Trigger: A close below the flag's lower boundary. Invalidation: A bounce that recovers much more than half the pole, or a close above the flag's upper boundary.
Automated detection for education and research; not a recommendation. Levels are drawn from split-adjusted daily prices.