OFG Bancorp (OFG)

NYSE Financials Regional Banks S&P SmallCap 600
$50.82
+0.13 (+0.26%)
Close of Nov 06, 2026 · end-of-day data
SMA 50SMA 2005Y/10Y use weekly candles (10/40-week averages)

Performance

price return
1W+1.6%
1M-0.2%
3M-2.5%
6M+10.5%
YTD+24.0%
1Y+27.1%
3Y+68.5%
5Y+96.2%

Key statistics

Full financials →
Market cap$2.1B
P/E (TTM)12.3
EPS (TTM, diluted)$4.12
P/S—
P/B1.59
EV / EBITDA—
Revenue (TTM)—
Revenue growth—
Net margin—
ROE14.5%
Debt / equity0.03
FCF yield14.0%
Dividend yield2.07%
Payout ratio25%
Beta (1Y)0.34
Volatility (1Y)23.2%
52-week range$35.71 – $54.47
Avg volume (50D)294.59K

Revenue & net income — last 8 quarters

Statements →

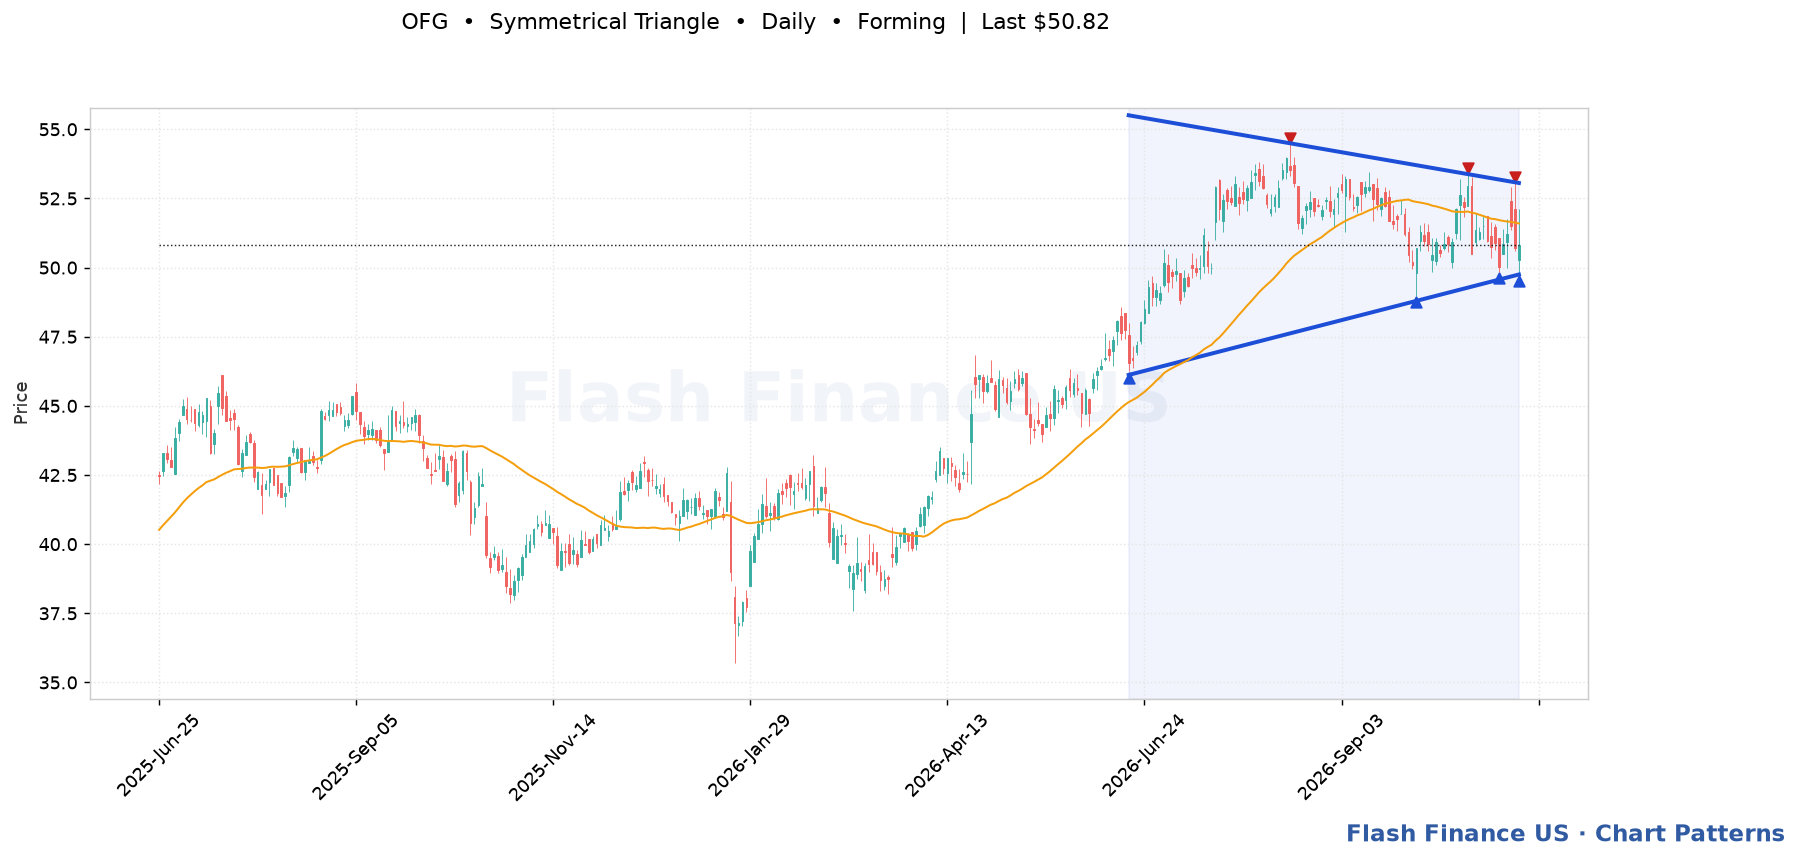
Chart pattern: Symmetrical Triangle (daily)

Forming
OFG Symmetrical Triangle chart

Trigger —. Details →

Filing briefs

OFG 8-K filings →
Oct 21, 8:29 AM ET

OFG Bancorp Q3 EPS $1.33, up from $1.16 a year ago but down from $1.39 in Q2

Mixed earnings 2.02

OFG Bancorp reported third-quarter 2026 results for the period ended September 30, 2026, with diluted EPS of $1.33, up from $1.16 in 3Q25 but down from $1.39 in 2Q26. Total core revenues were $185.7 million, versus $190.3 million in the prior quarter and $184.0 million a year earlier, and the company repurchased $13.5 million of common shares. The mixed picture matters to shareholders because year-over-year profit and revenue gains were offset by sequential declines, and tangible book value per share fell to $29.66 from $31.12 in 2Q26.

  • Diluted EPS $1.33 vs $1.39 in 2Q26 and $1.16 in 3Q25
  • Total core revenues $185.7 million vs $190.3 million in 2Q26 and $184.0 million in 3Q25
  • Non-interest expense $96.3 million vs $102.8 million in 2Q26, which included $5.8 million of business related operational charges
  • Tangible book value per share $29.66 vs $31.12 in 2Q26; $13.5 million of common shares repurchased
Read the filing on SEC.gov ↗

Briefs are written by AI from the filing text (each brief's own page names the model) and can contain mistakes — open the filing before acting on anything. Impact (1-5) and tone are the model's reading of the filing for shareholders, not a price forecast. Not investment advice.
Recent SEC filings

EDGAR ↗

Famous investors who own OFG

All investors →
InvestorValue% of portfolioLast quarter
Renaissance Technologies $884.93K0.00% New

From each investor's latest 13F filing (Q2 2026); positions are as of the quarter end and filed up to 45 days later.

Prices are end-of-day and split-adjusted. Financial data from OFG Bancorp's SEC XBRL filings. Not investment advice.